Mosaic of 10 m gridded multibeam bathymetry and bathymetry derived from multispectral IKONOS satellite imagery of Asuncion Island, Commonwealth of the Northern Marianas Islands, USA

Metadata also available as - [Outline] - [Parseable text] - [XML]

Frequently anticipated questions:


What does this data set describe?

Title:
Mosaic of 10 m gridded multibeam bathymetry and bathymetry derived from multispectral IKONOS satellite imagery of Asuncion Island, Commonwealth of the Northern Marianas Islands, USA
Abstract:
Gridded multibeam bathymetry is integrated with bathymetry derived from multpectral IKONOS satellite data. Gridded (10 m cell size) multibeam bathymetry collected aboard NOAA Ship Hiialaka'i and R/V AHI. Bathymetry values shallower than 15 m were derived by gauging the relative attenuation of blue and green spectral radiance as a function of depth. A multiple linear regression analysis of linearized blue and green band spectral values against depth determined the variables of y-intercept, blue slope and green slope values. Variables then used in multivariate slope intercept formula to derive depth. Variables were adjusted to improve the statistical accuracy and spatial coverage of the final derived bathymetry product. Digital image processing to derive depths conducted with the ENVI 4.5 software program while data editing and integration was performed using ArcGIS 9.3. This dataset is for the shelf environment of Asuncion Island, Commonwealth of the Northern Marianas Islands, USA
Supplemental_Information:
Gridded multibeam data were collected aboard the Hi'ialakai, a 218' United States National Oceanographic and Atmospheric Administration (NOAA) research ship, and aboard the R/V AHI (Acoustic Habitat Investigator), a 25' survey launch owned and operated by the NOAA Pacific Islands Fisheries Science Center in Honolulu, HI. The metadata for the bathymetry is documented in the product metadata, Asuncion_10m.txt. http://www.soest.hawaii.edu/pibhmc/pibhmc_cnmi_asu.htm Original IKONOS imagery was purchased to support the Pacific Islands Geographic Information System (GIS) project and National Ocean Service's (NOS) coral mapping activities. Orthographically corrected IKONOS Imagery was provided by NOAA's National Centers for Coastal Ocean Science, Center for Coastal Monitoring and Assessment. The metadata for this IKONOS imagery is documented in the original product metadata, po_107144_metadata (http://www.soest.hawaii.edu/pibhmc/)
  1. How might this data set be cited?
    Hogrefe Natural Systems Analysis in collaboration with Davey Jones Locker GIS Laboratory, Oregon State Universtiy for Coral Reef Ecosystem Division, NOAA Pacific Islands Fisheries Science Center, Pacific Islands Benthic Habitat Mapping Center, 20090123, Mosaic of 10 m gridded multibeam bathymetry and bathymetry derived from multispectral IKONOS satellite imagery of Asuncion Island, Commonwealth of the Northern Marianas Islands, USA.

    Online Links:

  2. What geographic area does the data set cover?
    West_Bounding_Coordinate: 145.361576
    East_Bounding_Coordinate: 145.437089
    North_Bounding_Coordinate: 19.727122
    South_Bounding_Coordinate: 19.646644
  3. What does it look like?
    http://www.soest.hawaii.edu/pibhmc/CNMI_images/asu_bathymetry_mb&IKONOS_10m_445.jpg (jpeg)
    Gridded Bathymetry
  4. Does the data set describe conditions during a particular time period?
    Beginning_Date: 03-Apr-2003
    Ending_Date: 08-Jun-2007
    Currentness_Reference: ground condition
  5. What is the general form of this data set?
    Geospatial_Data_Presentation_Form: raster digital data
  6. How does the data set represent geographic features?
    1. How are geographic features stored in the data set?
      This is a Raster data set. It contains the following raster data types:
      • Dimensions 932 x 783 x 1, type Pixel
    2. What coordinate system is used to represent geographic features?
      Grid_Coordinate_System_Name: Universal Transverse Mercator
      Universal_Transverse_Mercator:
      UTM_Zone_Number: 55
      Transverse_Mercator:
      Scale_Factor_at_Central_Meridian: 0.999600
      Longitude_of_Central_Meridian: 147.000000
      Latitude_of_Projection_Origin: 0.000000
      False_Easting: 500000.000000
      False_Northing: 0.000000
      Planar coordinates are encoded using Row and Column
      Abscissae (x-coordinates) are specified to the nearest 10.000000
      Ordinates (y-coordinates) are specified to the nearest 10.000000
      Planar coordinates are specified in meters
      The horizontal datum used is D_WGS_1984.
      The ellipsoid used is WGS_1984.
      The semi-major axis of the ellipsoid used is 6378137.000000.
      The flattening of the ellipsoid used is 1/298.257224.
  7. How does the data set describe geographic features?

Who produced the data set?

  1. Who are the originators of the data set? (may include formal authors, digital compilers, and editors)
  2. Who also contributed to the data set?
    NOAA PIFSC CRED, the Pacific Islands Benthic Habitat Mapping Center and Davey Jones Locker GIS Laboratory Oregon State University
  3. To whom should users address questions about the data?

Why was the data set created?

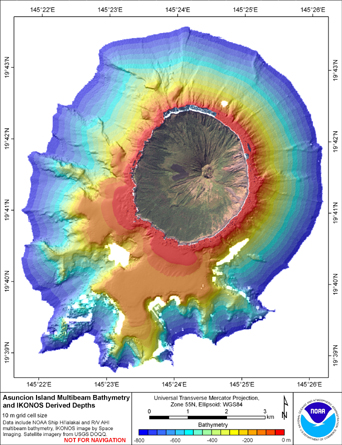
The data were derived in support of NOAA Coral Reef Conservation Program goals. Goal 1 is to map all U.S. Coral Reef Ecosystems. This data set specifically addresses Objective 1 and 4: to develop high-resolution benthic maps and to characterize priority deep water reefs and associated habitats. This integration of derived bathymetry with multibeam sonar data provides a GIS layer with expanded spatial coverage that may be used for benthic and essential fish habitat characterization, and for the study of geologic features. By combining the dataset with other bathymetry, backscatter, derivatives, and in situ data, they collectively compose benthic habitat maps designed to be used to understand and predict shallow depth (0m to 150m) benthic habitats for organisms that inhabit coral reef ecosystems.

How was the data set created?

  1. From what previous works were the data drawn?
  2. How were the data generated, processed, and modified?
    Date: 21-Jan-2009 (process 1 of 1)
    Multiple tools in ENVI 4.5 were used to complete the following processing steps: Data conversion from digital number to radiance, correction for atmosphere and water surface reflection, linearization of spectral decay as function of depth, masking of non-applicable values, and bathymetric derivation using variables from multiple linear regression analysis. Multiple tools in ArcGIS 9.3 were used for dataset integration and to extract values for the multiple linear regression analysis and subsequent error analyses. The statisitcs program S-Plus was used for the multiple linear regression analysis to provide original variables for depth derivation. The multivariate slope intercept formula used to derive depth was Depth=Yint+(Mblue)(Xblue)+(Mgreen)(Xgreen). Two derived products from the image asuncion_107144_msi_rat.pix (Asu144), were integrated to enhance statistical accuracy and expand spatial coverage. The original MLR variables for Asu144 were Yint=-12.6994, Mblue=-8.1453, and Mgreen=10.8586. Two additional products were derived to enhance accuracy and expand coverage. The first (Asu144_5m_DB9) was derived using increased linearized blue and green band slope values of -16.1453 and 18.8586 to increase statistical accuracy. The second (Asu144_5m_DB11) was derived using a increased slope value of -8.6994 with the original linearized blue and green band slope values. Data from Asu144_5m_DB9 replaced concurrent data from Asu144_5m_DB11 during integration due to better statistical accuracy. The derived bathymetry mosaic was (Asu_DBall_mos) was then integrated with the multibeam sonar data 10m grid, with sonar data prioritized over derived data, to create the final product (Asu_10m_DBMB). A detailed description of all processing steps is available at: http://oregonstate.edu/~hogrefek/Cookbook/Cookbook_042108.pdf An error analysis of each derived bathymetry grid used is available upon request.
  3. What similar or related data should the user be aware of?

How reliable are the data; what problems remain in the data set?

  1. How well have the observations been checked?
    Data are collected for resource management and research purposes and are tested for internal consistency; however, no effort is made to compare these data to external references or to other published data.
  2. How accurate are the geographic locations?
    Horizontal positioning system: GPS C/A Horizontal position accuracy: 25 meters
  3. How accurate are the heights or depths?
    Range resolution of sonar: varies with depth Raw sounding resolution: varies with depth Vertical accuracy of gridded sonar product: ~ 1% of water depth Vertical accuracy of derived bathymetry product: 5 meter range
  4. Where are the gaps in the data? What is missing?
    Complete
  5. How consistent are the relationships among the observations, including topology?
    These data are believed to be logically consistent though no tests were performed

How can someone get a copy of the data set?

Are there legal restrictions on access or use of the data?
Access_Constraints: None
Use_Constraints:
These data are not to be used for navigation purposes. Please acknowledge NOAA Pacific Islands Fisheries Science Center, the Joint Institute for Marine and Atmospheric Research (JIMAR) University of Hawaii and Davey Jones Locker GIS Laboratory Oregon State University as the sources of this information.
  1. Who distributes the data set? (Distributor 1 of 1)
    NOAA PIFSC CRED PIBHMC and DJLab OSU
    Attn: Kyle Hogrefe
    104 Wilkinson Hall, Oregon State University
    Corvallis, Oregon
    USA

    541-737-2397 (voice)
    hogrefek@geo.oregonstate.edu
  2. What's the catalog number I need to order this data set? Downloadable Data
  3. What legal disclaimers am I supposed to read?
    These data are not to be used for navigational purposes. NOAA makes no warranty regarding these data, expressed or implied, nor does the fact of distribution constitute such a warranty. NOAA cannot assume liability for any damages caused by any errors or omissions in these data, nor as a result of the failure of these data to function on a particular system.
  4. How can I download or order the data?

Who wrote the metadata?

Dates:
Last modified: 29-Mar-2020
Last Reviewed: 22-Dec-2009
Metadata author:
Kyle Hogrefe
NOAA PIFSC CRED PIBHMC and DJLab OSU
104 Wilkinson Hall, Oregon State University
Corvallis, Oregon
USA

541-740-8444 (voice)
hogrefek@geo.oregonstate.edu
Metadata standard:
FGDC Content Standards for Digital Geospatial Metadata (FGDC-STD-001-1998)

Generated by mp version 2.9.48 on Mon Mar 18 10:58:08 2024