CRED Simrad em300 multibeam backscatter data of Johnston Atoll, Pacific Remote Island Areas, Central Pacific in GeoTIFF format

Metadata also available as - [Outline] - [Parseable text] - [XML]

Frequently anticipated questions:


What does this data set describe?

Title:
CRED Simrad em300 multibeam backscatter data of Johnston Atoll, Pacific Remote Island Areas, Central Pacific in GeoTIFF format
Abstract:
Multibeam backscatter imagery extracted from gridded bathymetry of the shelf and slope environments of Johnston Island, Pacific Island Areas, Central Pacific. These data provide coverage between 10 and 5000 meters. The backscatter dataset includes data collected using Simrad EM300 and Reson 8101 multibeam sonars. The sonars frequencies are 30 kHz and 240 kHz respectively and the backscatter data from each sonar are processed and gridded separately. These metadata are for the 5 m grid cell size Simrad em300 multibeam backscatter data only.
Supplemental_Information:
Multibeam data were collected aboard the NOAA Ship Hi'ialakai, a 218' United States National Oceanographic and Atmospheric Administration research ship. The NOAA Ship Hi'ialakai's survey sensors include a 30 kHz Simrad EM300 sonar and a 300 kHz Simrad EM3002d sonar, which provide bathymetry and imagery data, a TSS/Applanix POS/MV Model 320, which measures position, velocity, attitude and heading, and a Seabird SBE 9/11 plus CTD used to measure sound velocity profiles. Specific equipment configurations are documented in metadata from cruises: HI0601. These metadata can be accessed at: http://www.soest.hawaii.edu/pibhmc/cms/cruise-catalog/.
  1. How might this data set be cited?
    Pacific Islands Benthic Habitat Mapping Center (PIBHMC), Coral Reef Ecosystem Division (CRED), Pacific Islands Fisheries Science Center (PIFSC), National Marine Fisheries Service (NMFS), National Oceanic and Atmospheric Administration (NOAA), 20070824, CRED Simrad em300 multibeam backscatter data of Johnston Atoll, Pacific Remote Island Areas, Central Pacific in GeoTIFF format.

    Online Links:

  2. What geographic area does the data set cover?
    West_Bounding_Coordinate: -169.7
    East_Bounding_Coordinate: -169.264
    North_Bounding_Coordinate: 16.9141
    South_Bounding_Coordinate: 16.5583
  3. What does it look like?
    http://www.soest.hawaii.edu/pibhmc/PRIAs_images/johnston-bs_440.jpg (JPEG)
    Multibeam Backscatter, Acoustic Imagery
    http://www.soest.hawaii.edu/pibhmc/PRIAs_images/johnston-em300-bs-boxes_440.jpg (JPEG)
    Multibeam Backscatter, Acoustic Imagery
  4. Does the data set describe conditions during a particular time period?
    Beginning_Date: 18-Jan-2006
    Ending_Date: 24-Jan-2006
    Currentness_Reference: ground condition
  5. What is the general form of this data set?
    Geospatial_Data_Presentation_Form: digital data
  6. How does the data set represent geographic features?
    1. How are geographic features stored in the data set?
      This is a Raster data set. It contains the following raster data types:
      • Dimensions 4706 x 4792 x 1, type Grid Cell
    2. What coordinate system is used to represent geographic features?
      Grid_Coordinate_System_Name: Universal Transverse Mercator
      Universal_Transverse_Mercator:
      UTM_Zone_Number: 2
      Transverse_Mercator:
      Scale_Factor_at_Central_Meridian: 0.9996
      Longitude_of_Central_Meridian: -171
      Latitude_of_Projection_Origin: 0
      False_Easting: 500000
      False_Northing: 0
      Planar coordinates are encoded using Row and Column
      Abscissae (x-coordinates) are specified to the nearest 5
      Ordinates (y-coordinates) are specified to the nearest 5
      Planar coordinates are specified in meters
      The horizontal datum used is D_WGS_1984.
      The ellipsoid used is WGS_1984.
      The semi-major axis of the ellipsoid used is 6378137.000000.
      The flattening of the ellipsoid used is 1/298.257224.
      Vertical_Coordinate_System_Definition:
      Depth_System_Definition:
      Depth_Datum_Name: mean lower low water
      Depth_Resolution: 0.01
      Depth_Distance_Units: meters
      Depth_Encoding_Method: Attribute Values
  7. How does the data set describe geographic features?
    Entity_and_Attribute_Overview:
    Sidescan data within a GSF file are arranged as small sequences of intensity values, one sequence per beam per ping. The intensity values represent the amplitude of echo returns to the sensor and can be related to seabed roughness.
    Entity_and_Attribute_Detail_Citation: none

Who produced the data set?

  1. Who are the originators of the data set? (may include formal authors, digital compilers, and editors)
  2. Who also contributed to the data set?
    PIBHMC, CRED, PIFSC, NOAA and JIMAR
  3. To whom should users address questions about the data?
    Pacific Islands Benthic Habitat Mapping Center (PIBHMC), Coral Reef Ecosystem Division (CRED), Pacific Islands Fisheries Science Center (PIFSC), National Marine Fisheries Service (NMFS), National Oceanic and Atmospheric Administration (NOAA)
    NOAA IRC
    Honolulu, HI

    808 725-5360 (voice)
    808 725-5429 (FAX)
    nmfs.pic.credinfo@noaa.gov
    Contact_Instructions: e-mail preferred

Why was the data set created?

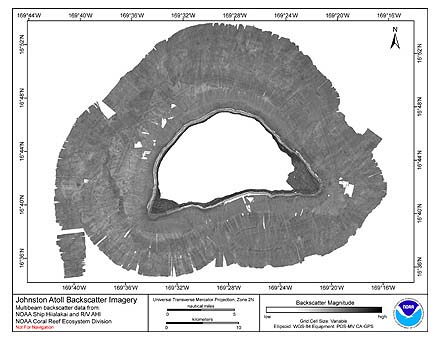
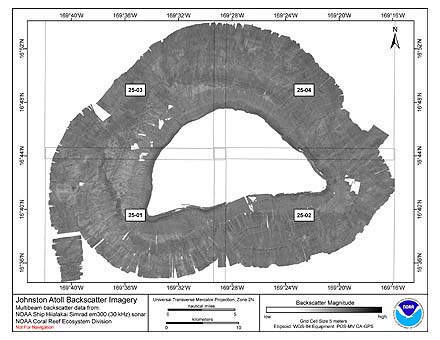
The GeoTIFFs of backscatter imagery were created using data gathered from multibeam soundings for use as a planning and reference document. The data are also being used for benthic habitat mapping, for locating Essential Fish Habitat, and for studying geologic features of the area. Refer to supplemental information for description of instrument and survey.

How was the data set created?

  1. From what previous works were the data drawn?
  2. How were the data generated, processed, and modified?
    Date: 28-Apr-2007 (process 1 of 1)
    Science Applications International Corporation's (SAIC) ISS-2000 acquires, processes and records data, provides survey control and underway quality control displays. SAIC's SABER processing software is used to process the raw soundings, analyze the results, manually edit the sounding data to remove outliers and derive average gridded data values. Additional data acquisition and processing information can be found in the metadata for cruises HI0601 Hawaii Mapping Research Group (HMRG) processing software was then used to extract values of acoustic intensity from the soundings. HMRG is an organization of scientists, engineers and technicians whose mission is to design, build, and operate tools for mapping the seafloor. HMRG is a group within the School of Ocean and Earth Science and Technology at the University of Hawaii at Manoa. The gsf2bs program (July, 2005) converts the swath bathymetry ping records contained within a GSF (Generic Sensor Format) version 2.02 dataset into bs file format. This is done as follows: (i) position each beam's bottom detect intensity sample at the across-track location of that beam's bathymetry value; (ii) assuming a flat bottom in the near neighborhood of the beam, compute across-track distances for all of the beam's remaining intensity samples based on their temporal relation to the bottom detect sample and the computed average sound velocity for that beam as derived from its range and travel time; (iii) after all of the intensity samples from all beams of a ping have been located in across-track distance, fill the gaps between them as necessary by comparing travel times of beams adjacent to the gap, assigning the position using the adjacent sample closest to nadir, and averaging the interpolated values that fall within a cell. The conversion described above is necessary in order to run HMRG backscatter processing operations on the data, such as filtering to remove noise, and to create netCDF grids, raster images and GeoTIFF's. For more information on the backscatter processing technique see <http://www.soest.hawaii.edu/pibhmc/pibhmc_documentation.htm>. Software_Used: SAIC ISS-2000 Acquisition Software, v 3.4 SAIC SABER Processing Software, v 3.3.15 Hawaii Mapping Research Group (HMRG) Processing Software GMT Generic Mapping Tools, v 4.1 MB System, v 5.0.7
  3. What similar or related data should the user be aware of?

How reliable are the data; what problems remain in the data set?

  1. How well have the observations been checked?
    Data are collected for resource management and research purposes and are tested for internal consistency; however, no effort is made to compare these data to external references or to other published data.
  2. How accurate are the geographic locations?
    Horizontal positioning system: GPS (SPS) Horizontal position accuracy: 25 meters
  3. How accurate are the heights or depths?
    1 m Range resolution of sonar ~1.25 cm Raw sounding resolution: Variable Vertical accuracy of gridded product: 1% of water depth
  4. Where are the gaps in the data? What is missing?
    Complete
  5. How consistent are the relationships among the observations, including topology?
    These data are believed to be logically consistent though no tests were performed

How can someone get a copy of the data set?

Are there legal restrictions on access or use of the data?
Access_Constraints: None
Use_Constraints:
These data are not to be used for navigation purposes. Please acknowledge NOAA and the Joint Institute for Marine and Atmospheric Research (JIMAR) University of Hawaii as the sources of this information. sources of this information.
  1. Who distributes the data set? (Distributor 1 of 1)
    Pacific Islands Benthic Habitat Mapping Center (PIBHMC), Coral Reef Ecosystem Division (CRED), Pacific Islands Fisheries Science Center (PIFSC), National Marine Fisheries Service (NMFS), National Oceanic and Atmospheric Administration (NOAA)
    NOAA IRC
    Honolulu, HI

    808 725-5360 (voice)
    808 725-5429 (FAX)
    nmfs.pic.credinfo@noaa.gov
    Contact_Instructions: e-mail preferred
  2. What's the catalog number I need to order this data set? Downloadable Data
  3. What legal disclaimers am I supposed to read?
    These data are not to be used for navigational purposes. NOAA makes no warranty regarding these data, expressed or implied, nor does the fact of distribution constitute such a warranty. NOAA cannot assume liability for any damages caused by any errors or omissions in these data, nor as a result of the failure of these data to function on a particular system.
  4. How can I download or order the data?

Who wrote the metadata?

Dates:
Last modified: 05-Jun-2019
Last Reviewed: 05-May-2009
Metadata author:
Pacific Islands Benthic Habitat Mapping Center (PIBHMC), Coral Reef Ecosystem Division (CRED), Pacific Islands Fisheries Science Center (PIFSC), National Marine Fisheries Service (NMFS), National Oceanic and Atmospheric Administration (NOAA)
NOAA IRC
Honolulu, HI

808 725-5360 (voice)
808 725-5429 (FAX)
nmfs.pic.credinfo@noaa.gov
Contact_Instructions: e-mail preferred
Metadata standard:
FGDC Content Standards for Digital Geospatial Metadata (FGDC-STD-001-1998)

Generated by mp version 2.9.48 on Mon Mar 18 10:58:20 2024