Preliminary hard and soft bottom seafloor substrate map (40m grid) derived from an unsupervised classification of gridded backscatter and bathymetry derivatives at Rose Atoll, Territory of American Samoa, USA.

Metadata also available as - [Outline] - [Parseable text] - [XML]

Frequently anticipated questions:


What does this data set describe?

Title:
Preliminary hard and soft bottom seafloor substrate map (40m grid) derived from an unsupervised classification of gridded backscatter and bathymetry derivatives at Rose Atoll, Territory of American Samoa, USA.
Abstract:
Preliminary hard and soft seafloor substrate map derived from an unsupervised classification of multibeam backscatter and bathymetry derivatives at Rose Atoll, Territory of American Samoa, USA. The dataset was created from gridded (40 m cell size) multibeam bathymetry derivatives collected aboard R/V AHI; 2 scales of bathymetric variance and bathymetric rugosity, and from multibeam backscatter. Backscatter data were from a 30 kHz Simrad EM300 sonar, gridded at 5 m. Very limited seafloor photographs for groundtruthing are available for Rose Atoll and therefore no supervised classification was performed and we are unable to visually or empirically evaluate the accuracy of the unsupervised classification seafloor substrate map. However, in locations such French Frigate Shoals, NWHI and Tutuila, American Samoa, where ground truth data are available, the unsupervised classification method is a robust predictor of substrate type in similar depth ranges and seafloor environments. Since groundtruthing was not used to validate the unsupervised classification at Rose Atoll extreme caution should be used when examining these data to locate habitat of biological significance. The map should be used in conjunction with bathymetric derivatives such as rugosity, slope, and Bathymetric Position Index (BPI).
Supplemental_Information:
Gridded multibeam data were collected aboard the NOAA Ship Hi'ialakai, a 218 ft United States National Oceanographic and Atmospheric Administration research ship. The process for deriving the 40-m gridded multibeam bathymetry is described in Rose_40m.asc.txt, available on www.soest.hawaii.edu/pibhmc. The resulting grid (rose_40m.grd) was clipped using the ESRI ArcToolbox tool 'Extract by Mask' leaving only the multibeam data collected on the slopes surrounding the atoll and excluding the discontinuous data around the base of the slopes. Classification was carried out using this clipped dataset. Finer resolution data were available for within the lagoon, and these were classified separately (Rose_5m_hardsoft.jpg). and are also available on www.soest.hawaii.edu/pibhmc. The metadata for the lagoon hard-soft classification can be seen at Rose_5m_hardsoft.txt. The process for deriving the 5-m gridded multibeam backscatter is described in rose-em300-bs-5m.grd.txt. Prior to classification the backscatter data were re-gridded at 40-m using the resample tool in the Arc Toolbox. The 40-m rugosity and bathymetric variance grids were generated for use in the classification process and are not served separately. See the process description portion of this document for additional informaiton about how the variance and unsupervised layers were derived.
  1. How might this data set be cited?
    Pacific Islands Benthic Habitat Mapping Center (PIBHMC), Coral Reef Ecosystem Division (CRED), Pacific Islands Fisheries Science Center (PIFSC), National Marine Fisheries Service (NMFS), National Oceanic and Atmospheric Administration (NOAA), 20110729, Preliminary hard and soft bottom seafloor substrate map (40m grid) derived from an unsupervised classification of gridded backscatter and bathymetry derivatives at Rose Atoll, Territory of American Samoa, USA..

    Online Links:

  2. What geographic area does the data set cover?
    West_Bounding_Coordinate: -168.176635
    East_Bounding_Coordinate: -168.131605
    North_Bounding_Coordinate: -14.525078
    South_Bounding_Coordinate: -14.563367
  3. What does it look like?
    http://www.soest.hawaii.edu/pibhmc/amsamoa_images/Rose_40m_hardsoft_440.jpg (JPEG, PDF)
    Hard and Soft Seafloor Substrate
  4. Does the data set describe conditions during a particular time period?
    Beginning_Date: 10-Feb-2006
    Ending_Date: 13-Mar-2006
    Currentness_Reference: ground condition
  5. What is the general form of this data set?
    Geospatial_Data_Presentation_Form: digital data
  6. How does the data set represent geographic features?
    1. How are geographic features stored in the data set?
      This is a Raster data set. It contains the following raster data types:
      • Dimensions 544 x 469 x 1, type Grid Cell
    2. What coordinate system is used to represent geographic features?
      Grid_Coordinate_System_Name: Universal Transverse Mercator
      Universal_Transverse_Mercator:
      UTM_Zone_Number: -2
      Transverse_Mercator:
      Scale_Factor_at_Central_Meridian: 0.9996
      Longitude_of_Central_Meridian: -171
      Latitude_of_Projection_Origin: 0
      False_Easting: 500000
      False_Northing: 10000000
      Planar coordinates are encoded using Row and Column
      Abscissae (x-coordinates) are specified to the nearest 40
      Ordinates (y-coordinates) are specified to the nearest 40
      Planar coordinates are specified in meters
      The horizontal datum used is D_WGS_1984.
      The ellipsoid used is WGS_1984.
      The semi-major axis of the ellipsoid used is 6378137.000000.
      The flattening of the ellipsoid used is 1/298.257224.
      Vertical_Coordinate_System_Definition:
      Depth_System_Definition:
      Depth_Datum_Name: mean lower low water
      Depth_Resolution: 0.01
      Depth_Distance_Units: meters
      Depth_Encoding_Method: Attribute Values
  7. How does the data set describe geographic features?
    Entity_and_Attribute_Overview: none
    Entity_and_Attribute_Detail_Citation: none

Who produced the data set?

  1. Who are the originators of the data set? (may include formal authors, digital compilers, and editors)
  2. Who also contributed to the data set?
    PIBHMC, CRED, PIFSC, NOAA, and JIMAR
  3. To whom should users address questions about the data?
    Pacific Islands Benthic Habitat Mapping Center (PIBHMC), Coral Reef Ecosystem Division (CRED), Pacific Islands Fisheries Science Center (PIFSC), National Marine Fisheries Service (NMFS), National Oceanic and Atmospheric Administration (NOAA)
    NOAA IRC
    Honolulu, HI

    808 725-5360 (voice)
    808 725-5429 (FAX)
    nmfs.pic.credinfo@noaa.gov
    Contact_Instructions: e-mail preferred

Why was the data set created?

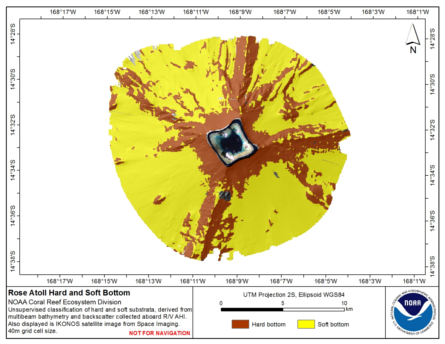
The hard and soft seafloor map is being used to improve sampling techniques for long-term ecosystem monitoring, to guide future ground-truthing operations and to identify coral-rich and species specific environments. This is a preliminary product and the methods used to generate the map are currently being evaluated for their accuracy.

How was the data set created?

  1. From what previous works were the data drawn?
  2. How were the data generated, processed, and modified?
    Date: 21-Feb-2011 (process 1 of 1)
    Processing steps used to generate the backscatter and bathymetry grids used in the unsupervised classification process are described in their own metadata that can be found at www.soest.hawaii.edu/pibhmc. Rugosity grid was derived from the 40m gridded multibeam bathymetry (clipped as described above) using the Benthic Terrain Modeler (BTM). The BTM may be downloaded from https://coast.noaa.gov/digitalcoast//tools/btm/index.html. The BTM, written for ArcGIS ArcGIS 8.x or 9.x, includes a component for deriving rugosity using methods by Jeff Jenness that he wrote for ArcView 3.x. Bathymetric variance was calculated from the 40 m multibeam bathymetry in a two-step process using ArcMap Version 9.2. The first step involved calculating the standard deviation of the bathymetry layer using the Neighborhood Statistic tool from the Spatial Analyst pull-down menu in ArcMap Version 9.2. Rectangular neighborhood settings were set to a height and width of 3 grid cells to create a small-scale variance layer. The standard deviation output was then squared using the ArcMap Raster Calculater tool. A large-scale variance layer was also generated using a rectangular neighborhood height and width of 5 grid cells. The fine-scale variance is useful for defining small features that may indicate the presence of sediment ripples or possible coral-rich areas whereas the large-scale variance is useful for defining seafloor ridges, pinnacles, and significant changes in slope. Bathymetric variance proved to be a useful tool in previous efforts to map seafloor habitats by Dartnell and Gardner (2004). Their publication can be downloaded from www.soest.hawaii.edu/pibhmc/pibhmc_documentation.htm. The layers were then opened as ESRI GRIDS in the image processing software package ENVI (Environment for Visualizing Images) Version 4.3. A multi-band image was then created with the backscatter, small- and large-scale variance, and rugosity. A mask was also created in ENVI for the dataset. Image classification was performed on the multi-band image using the K-Means unsupervised classification method, which calculates initial class means evenly distributed in the data space and then iteratively clusters the pixels into the nearest class using a minimum distance technique. More information about K-Means algorithm can be found in the ENVI documentation available at www.ittvis.com/envi/. The number of classes was set to two and all other options were set to default. Class color mapping was performed on the resulting classified images. The substrate types of hard and soft were assigned based on a visual interpretation of backscatter intensity and corresponding classes.
  3. What similar or related data should the user be aware of?

How reliable are the data; what problems remain in the data set?

  1. How well have the observations been checked?
    Data are collected for resource management and research purposes and are tested for internal consistency; however, no effort is made to compare these data to external references or to other published data.
  2. How accurate are the geographic locations?
    Horizontal positioning system: GPS (SPS) Horizontal position accuracy: 25 meters
  3. How accurate are the heights or depths?
    1 m Range resolution of sonar ~1.25 cm Raw sounding resolution: Variable Vertical accuracy of gridded product: 1% of water depth
  4. Where are the gaps in the data? What is missing?
    Complete
  5. How consistent are the relationships among the observations, including topology?
    These data are believed to be logically consistent though no tests were performed

How can someone get a copy of the data set?

Are there legal restrictions on access or use of the data?
Access_Constraints: None
Use_Constraints:
These data are not to be used for navigation purposes. Please acknowledge the NOAA Pacific Islands Fisheries Science Center (PIFSC) Coral Reef Ecosystem Division (CRED) and the Pacific Islands Benthic Habitat Mapping Center (PIBHMC), and the Joint Institute for Marine and Atmospheric Research (JIMAR) and School of Ocean and Earth Science and Technology (SOEST), University of Hawaii as the sources of this information.
  1. Who distributes the data set? (Distributor 1 of 1)
    Pacific Islands Benthic Habitat Mapping Center (PIBHMC), Coral Reef Ecosystem Division (CRED), Pacific Islands Fisheries Science Center (PIFSC), National Marine Fisheries Service (NMFS), National Oceanic and Atmospheric Administration (NOAA)
    NOAA IRC
    Honolulu, HI

    808 725-5360 (voice)
    808 725-5429 (FAX)
    nmfs.pic.credinfo@noaa.gov
    Contact_Instructions: e-mail preferred
  2. What's the catalog number I need to order this data set? Downloadable Data
  3. What legal disclaimers am I supposed to read?
    These data are not to be used for navigational purposes. NOAA makes no warranty regarding these data, expressed or implied, nor does the fact of distribution constitute such a warranty. NOAA cannot assume liability for any damages caused by any errors or omissions in these data, nor as a result of the failure of these data to function on a particular system.
  4. How can I download or order the data?

Who wrote the metadata?

Dates:
Last modified: 26-May-2019
Last Reviewed: 30-Aug-2011
Metadata author:
Pacific Islands Benthic Habitat Mapping Center (PIBHMC), Coral Reef Ecosystem Division (CRED), Pacific Islands Fisheries Science Center (PIFSC), National Marine Fisheries Service (NMFS), National Oceanic and Atmospheric Administration (NOAA)
NOAA IRC
Honolulu, HI

808 725-5360 (voice)
808 725-5429 (FAX)
nmfs.pic.credinfo@noaa.gov
Contact_Instructions: e-mail preferred
Metadata standard:
FGDC Content Standards for Digital Geospatial Metadata (FGDC-STD-001-1998)

Generated by mp version 2.9.48 on Thu Apr 18 11:02:15 2024