Mosaic of gridded multibeam bathymetry and bathymetry derived from multispectral IKONOS satellite imagery of Rose Atoll, American Samoa, USA

Metadata also available as - [Outline] - [Parseable text] - [XML]

Frequently anticipated questions:


What does this data set describe?

Title:
Mosaic of gridded multibeam bathymetry and bathymetry derived from multispectral IKONOS satellite imagery of Rose Atoll, American Samoa, USA
Abstract:
Gridded multibeam bathymetry is integrated with bathymetry derived from multispectral IKONOS satellite data. Gridded (5 m cell size) multibeam bathymetry were collected aboard the R/V AHI (Acoustic Habitat Investigator). Bathymetry values shallower than 25 m were derived from multispectral IKONOS satellite image by analyzing the relative attenuation of blue and green spectral radiance as a function of depth. A multiple linear regression analysis of linearized blue and green band spectral values against multibeam depths determined the variables of y-intercept, blue slope and green slope values. Variables were then used in multivariate slope intercept formula to derive depth. Variables were adjusted to improve the statistical accuracy and spatial coverage of the final derived bathymetry product. Digital image processing to derive depths conducted with the ENVI 4.5 software program while data editing and integration was performed using ArcGIS 9.3. This dataset is for the bank and lagoon environment of Rose Atoll, American Samoa, USA.
Supplemental_Information:
Geographic Information System (GIS) project and National Ocean Service's (NOS) coral mapping activities. Orthographically corrected IKONOS Imagery was provided by NOAA's National Centers for Coastal Ocean Science, Center for Coastal Monitoring and Assessment. The metadata for this IKONOS imagery is documented in the original product metadata, po_87351_metadata_rose (http://www.soest.hawaii.edu/pibhmc/) Gridded multibeam data were collected aboard the R/V AHI (Acoustic Habitat Investigator), a 25' survey launch owned and operated by the NOAA Pacific Islands Fisheries Science Center in Honolulu, HI. The metadata for the bathymetry is documented in the product metadata, Rose_5m.asc.txt. http://www.soest.hawaii.edu/pibhmc/pibhmc_amsamoa_rose.htm
  1. How might this data set be cited?
    Pacific Islands Benthic Habitat Mapping Center (PIBHMC), Coral Reef Ecosystem Division (CRED), Pacific Islands Fisheries Science Center (PIFSC), National Marine Fisheries Service (NMFS), National Oceanic and Atmospheric Administration (NOAA), 20100607, Mosaic of gridded multibeam bathymetry and bathymetry derived from multispectral IKONOS satellite imagery of Rose Atoll, American Samoa, USA.

    Online Links:

  2. What geographic area does the data set cover?
    West_Bounding_Coordinate: -168.173489
    East_Bounding_Coordinate: -168.136652
    North_Bounding_Coordinate: -14.527710
    South_Bounding_Coordinate: -14.561023
  3. What does it look like?
    http://www.soest.hawaii.edu/pibhmc/amsamoa_images/Rose_bathymetry_mb&IKONOS_445.jpg (JPEG)
    Gridded Bathymetry
  4. Does the data set describe conditions during a particular time period?
    Beginning_Date: 05-Mar-2002
    Ending_Date: 13-Mar-2006
    Currentness_Reference: ground condition
  5. What is the general form of this data set?
    Geospatial_Data_Presentation_Form: raster digital data
  6. How does the data set represent geographic features?
    1. How are geographic features stored in the data set?
      This is a Raster data set. It contains the following raster data types:
      • Dimensions 835 x 917 x 1, type Grid Cell
    2. What coordinate system is used to represent geographic features?
      Grid_Coordinate_System_Name: Universal Transverse Mercator
      Universal_Transverse_Mercator:
      UTM_Zone_Number: -2
      Transverse_Mercator:
      Scale_Factor_at_Central_Meridian: 0.999600
      Longitude_of_Central_Meridian: -171.000000
      Latitude_of_Projection_Origin: 0.000000
      False_Easting: 500000.000000
      False_Northing: 10000000.000000
      Planar coordinates are encoded using Row and Column
      Abscissae (x-coordinates) are specified to the nearest 5.000000
      Ordinates (y-coordinates) are specified to the nearest 5.000000
      Planar coordinates are specified in meters
      The horizontal datum used is D_WGS_1984.
      The ellipsoid used is WGS_1984.
      The semi-major axis of the ellipsoid used is 6378137.000000.
      The flattening of the ellipsoid used is 1/298.257224.
  7. How does the data set describe geographic features?

Who produced the data set?

  1. Who are the originators of the data set? (may include formal authors, digital compilers, and editors)
  2. Who also contributed to the data set?
    NOAA PIFSC CRED, the Pacific Islands Benthic Habitat Mapping Center and Davey Jones Locker GIS Laboratory Oregon State University
  3. To whom should users address questions about the data?

Why was the data set created?

The data were derived in support of NOAA Coral Reef Conservation Program goals. Goal 1 is to map all U.S. Coral Reef Ecosystems. This data set specifically addresses Objective 1 and 4: to develop high-resolution benthic maps and to characterize priority deep water reefs and associated habitats. This integration of derived bathymetry data provides a GIS layer with expanded spatial coverage that may be used for benthic and essential fish habitat characterization, and for the study of geologic features. By combining the dataset with other bathymetry, backscatter, derivatives, and in situ data, they collectively compose benthic habitat maps designed to be used to understand and predict shallow depth (0m to 150m) benthic habitats for organisms that inhabit coral reef ecosystems.

How was the data set created?

  1. From what previous works were the data drawn?
  2. How were the data generated, processed, and modified?
    Date: 01-Jun-2010 (process 1 of 1)
    Multiple tools in ENVI 4.5 were used to complete the following processing steps: Data conversion from digital number to radiance, correction for atmosphere and water surface reflection, linearization of spectral decay as function of depth, masking of non-applicable values, and bathymetric derivation using variables from multiple linear regression analysis. Multiple tools in ArcGIS 9.3 were used for dataset integration and to extract values for the multiple linear regression analysis and subsequent error analyses. The statistics program S-Plus was used for the multiple linear regression analysis to provide original variables for depth derivation. The multivariate slope intercept formula used to derive depth was Depth=Yint+(Mblue)(Xblue)+(Mgreen)(Xgreen). Fourteen derived products from the image rose_msi_rat_final (Rose351) were integrated to expand spatial coverage. This image was provided in TIFF format. The original MLR variables for Rose351 were Yint=13.2711, Mblue=1.8847, and Mgreen=11.2034. The product derived from these variables (Rose351_DB) was mosaiced with thirteen additional products derived using increasingly reduced Y-intercept values as follows: Yint=12.2711 (Rose351_DB1), Yint=11.2711 (Rose351_DB2), Yint=10.2711 (Rose351_DB3), Yint=9.2711 (Rose351_DB4), Yint=8.2711 (Rose351_DB5), Yint=7.2711 (Rose351_DB6), Yint=6.2711 (Rose351_DB7), Yint=5.2711 (Rose351_DB8), Yint=4.2711 (Rose351_DB9), Yint=3.2711 (Rose351_DB10), Yint=2.2711 (Rose351_DB11), Yint=1.2711 (Rose351_DB12), Yint=0.2711 (Rose351_DB13). This was done to increase coverage in shallow areas. A detailed description of these processing steps is available at: http://oregonstate.edu/~hogrefek/Cookbook/Cookbook_042108.pdf An error analysis of each derived bathymetry grid used is available from PIBHMC upon request.

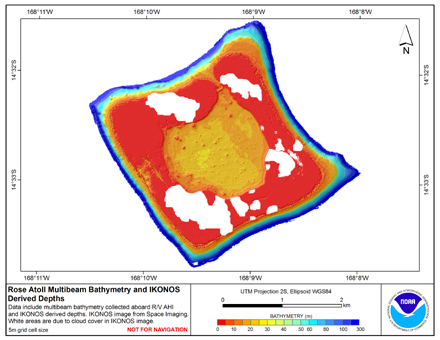
    This mosaiced derived bathymetry product (rose_dball2) was then integrated with the multibeam sonar data, with sonar data prioritized over derived data, to create the final product (rose_5m_dbmb), through the following steps.

    Initially, grdmath, a Generic Mapping Tools (GMT) algorithm that combines multiple grids, was used to combine the mosaicked derived bathymetry product (rose_dball2) with the gridded multibeam bathymetry (rose_5m). The AND operator was used to prioritize use of the multibeam grid over the derived bathymetry grid, where the two overlapped. The resulting product was found to have a noticeable artifact in the form of a marked step in depth on the bank top, where the derived bathymetry and multibeam bathymetry grids met. To avoid this problem, the final product was created by integrating the mosaic derived bathymetry product (rose_dball2) with an extracted subset of the multibeam data that only covered the inner lagoon. First, Fledermaus 3D Editor was used to extract xyz values from the multibeam data to create a subset covering the inner lagoon (rose_lagoon.xyz). The GMT nearneighbor algorithm was used to create a netCDF grid from the lagoon multibeam data. Secondly, xyz points were extracted from the derived bathymetry product (rose_dball2) using the Sample tool, available in ESRI ArcToolbox. The GMT nearneighbor algorithm was used to create a nearneighbor grid from these data. The two nearneighbor grids (one from the lagoon multibeam bathymetry and one from the mosaiced derived bathymetry product) were combined using grdmath. The AND operator was used to prioritize use of the multibeam grid over the derived bathymetry grid, where the two overlapped. The resulting grid (ros_5m_dbmb.nn.grd) was then converted to ASCII format using LINUX/UNIX commands in combination with GMT. (rose_5m_dmbm.asc). GMT is an open source collection of tools for manipulating geographic data sets. Additional information about GMT can be found at: www.soest.hawaii.edu/gmt

  3. What similar or related data should the user be aware of?

How reliable are the data; what problems remain in the data set?

  1. How well have the observations been checked?
    Data are collected for resource management and research purposes and are tested for internal consistency; however, no effort is made to compare these data to external references or to other published data.
  2. How accurate are the geographic locations?
    Horizontal positioning system: GPS C/A Horizontal position accuracy: 25 meters
  3. How accurate are the heights or depths?
    Range resolution of sonar: varies with depth Raw sounding resolution: varies with depth Vertical accuracy of gridded sonar product: ~ 1% of water depth Vertical accuracy of derived bathymetry product: 5 meter range
  4. Where are the gaps in the data? What is missing?
    Complete
  5. How consistent are the relationships among the observations, including topology?
    These data are believed to be logically consistent though no tests were performed

How can someone get a copy of the data set?

Are there legal restrictions on access or use of the data?
Access_Constraints: None
Use_Constraints:
These data are not to be used for navigation purposes. Please acknowledge NOAA Pacific Islands Fisheries Science Center, the Joint Institute for Marine and Atmospheric Research (JIMAR) University of Hawaii and Davey Jones Locker GIS Laboratory Oregon State University as the sources of this information.
  1. Who distributes the data set? (Distributor 1 of 1)
    Pacific Islands Benthic Habitat Mapping Center (PIBHMC), Coral Reef Ecosystem Division (CRED), Pacific Islands Fisheries Science Center (PIFSC), National Marine Fisheries Service (NMFS), National Oceanic and Atmospheric Administration (NOAA)
    Attn: John Rooney
    NOAA IRC
    Honolulu, HI

    808 725-5360 (voice)
    808 725-5429 (FAX)
    nmfs.pic.credinfo@noaa.gov
    Contact_Instructions: e-mail preferred
  2. What's the catalog number I need to order this data set? Downloadable Data
  3. What legal disclaimers am I supposed to read?
    These data are not to be used for navigational purposes. NOAA makes no warranty regarding these data, expressed or implied, nor does the fact of distribution constitute such a warranty. NOAA cannot assume liability for any damages caused by any errors or omissions in these data, nor as a result of the failure of these data to function on a particular system.
  4. How can I download or order the data?

Who wrote the metadata?

Dates:
Last modified: 29-Mar-2020
Last Reviewed: 23-Aug-2010
Metadata author:
Pacific Islands Benthic Habitat Mapping Center (PIBHMC), Coral Reef Ecosystem Division (CRED), Pacific Islands Fisheries Science Center (PIFSC), National Marine Fisheries Service (NMFS), National Oceanic and Atmospheric Administration (NOAA)
Attn: CRED Data Management Team
NOAA IRC
Honolulu, HI

808 725-5360 (voice)
808 725-5429 (FAX)
nmfs.pic.credinfo@noaa.gov
Contact_Instructions: e-mail preferred
Metadata standard:
FGDC Content Standards for Digital Geospatial Metadata (FGDC-STD-001-1998)

Generated by mp version 2.9.48 on Mon Apr 22 11:01:25 2024