Citation:
Citation_Information:
Originator:
Pacific Islands Benthic Habitat Mapping Center (PIBHMC), Coral Reef Ecosystem Division (CRED), Pacific Islands Fisheries Science Center (PIFSC), National Marine Fisheries Service (NMFS), National Oceanic and Atmospheric Administration (NOAA)
Publication_Date: 20081215
Title:
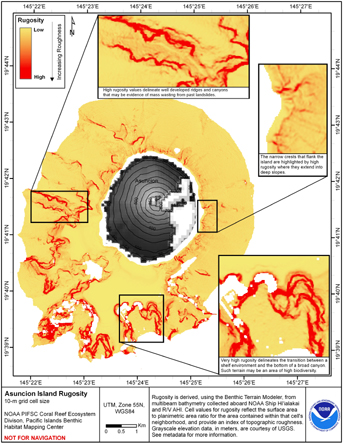
Rugosity 10 m grid derived from gridded bathymetry of Asuncion Island,
Commonwealth of the Northern Mariana Islands (CNMI), USA
Geospatial_Data_Presentation_Form: raster digital data
Online_Linkage: http://www.soest.hawaii.edu/pibhmc
Description:
Abstract:
Rugosity is derived from gridded (10 m cell size)
multibeam bathymetry collected aboard NOAA Ship Hiialaka'i and
R/V AHI, using the Benthic Terrain Modeler with rugosity methods by
Jeff Jenness (2003). Cell values reflect the surface area to planimetric
area ratio for the area contained within that cell's neighborhood.
They provide indices of topographic roughness & convolutedness. This
data set is for the shelf environment of Asuncion Island.
Purpose:
The data were derived in support of NOAA Coral Reef Conservation
Program goals. Goal 1 is to map all U.S. Coral Reef Ecosystems.
This data set specifically addresses Objective 1 and 4: to develop
high-resolution benthic maps and to characterize priority deep
water reefs and associated habitats. This derivative of bathymetry
provides a GIS layer that may be used for benthic and essential fish
habitat characterization, and for the study of geologic features.
By combining the dataset with bathymetry, backscatter, other
derivatives, and in situ data, they collectively compose benthic
habitat maps which are designed to help understand and predict moderate
depth (~20m to 800m) benthic habitats in coral reef ecosystems.
Supplemental_Information:
Gridded multibeam data were collected aboard the Hi'ialakai, a 218'
United States National Oceanographic and Atmospheric Administration
(NOAA) research ship, and aboard the R/V AHI (Acoustic Habitat
Investigator), a 25' survey launch owned and operated by the NOAA
Pacific Islands Fisheries Science Center in Honolulu, HI. The
metadata for the bathymetry is documented in the product metadata,
asuncion_10m.txt.
(
http://www.soest.hawaii.edu/pibhmc/pibhmc_cnmi_bathy.htm)
References:
Jenness, J. 2003. Grid surface areas: Surface area and ratios from
elevation grids [Electronic manual]. Jenness Enterprises:
ArcView Extensions.
http://www.jennessent.com/arcview/arcview_extensions.htm
Lundblad et al., 2006, A benthic terrain classification scheme for
American Samoa, Marine Geodesy, 29(2):89 - 111.
https://coast.noaa.gov/digitalcoast/tools/btm.html
CNMI and Guam rugosity maps are all symbolized with the same
stretched color ramp (1.5 standard deviations) in order to provide a
standard for qualitative comparisons between islands. Each island has
a unique maximum value for rugosity causing the distribution of values
across the color ramp to vary slightly. It is recommended that
the actual data set be used for integrated analysis in order to make
quantitative observations. The values for this data set range from
1.000 to 12.749 with a mean of 1.062 and a standard deviation of 0.132.
The terrestrial elevation data shown in the map for this data set are
SRTM Finished 3 arc sec Shaded Relief. They were collected during
NASA's Shuttle Radar Topograph Mission (SRTM). For more information
on the mission, go to:
http://www2.jpl.nasa.gov/srtm/faq.html#data. The data are available
from the United States Geological Survey (USGS) as reformatted
elevation data that are consistent with other Digital Elevation Models.
Time_Period_of_Content:
Time_Period_Information:
Range_of_Dates/Times:
Beginning_Date: 20070525
Ending_Date: 20070608
Currentness_Reference: ground condition
Status:
Progress: Complete
Maintenance_and_Update_Frequency: As needed
Spatial_Domain:
Bounding_Coordinates:
West_Bounding_Coordinate: 145.362
East_Bounding_Coordinate: 145.437
North_Bounding_Coordinate: 19.727
South_Bounding_Coordinate: 19.642
Keywords:
Theme:
Theme_Keyword_Thesaurus: NCEI Geoportal Filter
Theme_Keyword: CoRIS_Metadata
Theme:
Theme_Keyword_Thesaurus: CRCP Project
Theme_Keyword:
Benthic Habitat Mapping and Characterization - Commonwealth of the Northern Mariana Islands and Guam
Theme_Keyword: 1398
Theme:
Theme_Keyword_Thesaurus: CoRIS Discovery Thesaurus
Theme_Keyword: Geographic Information > Habitats
Theme:
Theme_Keyword_Thesaurus: ISO 19115 Topic Category
Theme_Keyword: imageryBaseMapsEarthCover
Theme_Keyword: 010
Theme:
Theme_Keyword_Thesaurus: CoRIS Theme Thesaurus
Theme_Keyword:
EARTH SCIENCE > Oceans > Bathymetry/Seafloor Topography > Rugosity
Theme:
Theme_Keyword_Thesaurus: None
Theme_Keyword: Rugosity
Theme_Keyword: Bathymetry
Theme_Keyword: Multibeam sonar
Place:
Place_Keyword_Thesaurus: None
Place_Keyword: Asuncion Island
Place_Keyword: Commonwealth of the Northern Mariana Islands
Place_Keyword: United States of America
Place:
Place_Keyword_Thesaurus: CoRIS Place Thesaurus
Place_Keyword:
COUNTRY/TERRITORY > Northern Mariana Islands > Asuncion Island > Asuncion Island (19N145E0001)
Place_Keyword:
OCEAN BASIN > Pacific Ocean > Western Pacific Ocean > Asuncion Island > Asuncion Island (19N145E0001)
Place:
Place_Keyword_Thesaurus: CoRIS Region
Place_Keyword: CNMI
Access_Constraints: None
Use_Constraints:
These data are not to be used for navigation purposes. Please acknowledge the NOAA Pacific Islands Fisheries
Science Center (PIFSC) Coral Reef Ecosystem Division (CRED) and
the Pacific Islands Benthic Habitat Mapping Center (PIBHMC), and
the Joint Institute for Marine and Atmospheric Research (JIMAR)
as the sources of this information.
Point_of_Contact:
Contact_Information:
Contact_Organization_Primary:
Contact_Organization:
Pacific Islands Benthic Habitat Mapping Center (PIBHMC), Coral Reef Ecosystem Division (CRED), Pacific Islands Fisheries Science Center (PIFSC), National Marine Fisheries Service (NMFS), National Oceanic and Atmospheric Administration (NOAA)
Contact_Person: Dr. John Rooney
Contact_Address:
Address_Type: mailing and physical address
Address: NOAA IRC
Address: NMFS/PIFSC/CRED
Address: 1845 WASP Blvd., Building 176
City: Honolulu
State_or_Province: HI
Postal_Code: 96818
Contact_Voice_Telephone: 808 725-5360
Contact_Facsimile_Telephone: 808 725-5429
Contact_Electronic_Mail_Address: nmfs.pic.credinfo@noaa.gov
Contact_Instructions: e-mail preferred
Browse_Graphic:
Browse_Graphic_File_Name:
Browse_Graphic_File_Description: Gridded Bathymetry
Browse_Graphic_File_Type: JPEG
Data_Set_Credit: NOAA PIFSC CRED PIBHMC and JIMAR
Security_Information:
Security_Classification_System: Not applicable
Security_Classification: Unclassified
Security_Handling_Description: Not applicable
Native_Data_Set_Environment:
ArcGIS ASCII file, derived from bathymetry in
ArcGIS 9.3, Spatial Analyst