Online Links:
| Range of values | |
|---|---|
| Minimum: | 0 |
| Maximum: | 255 |
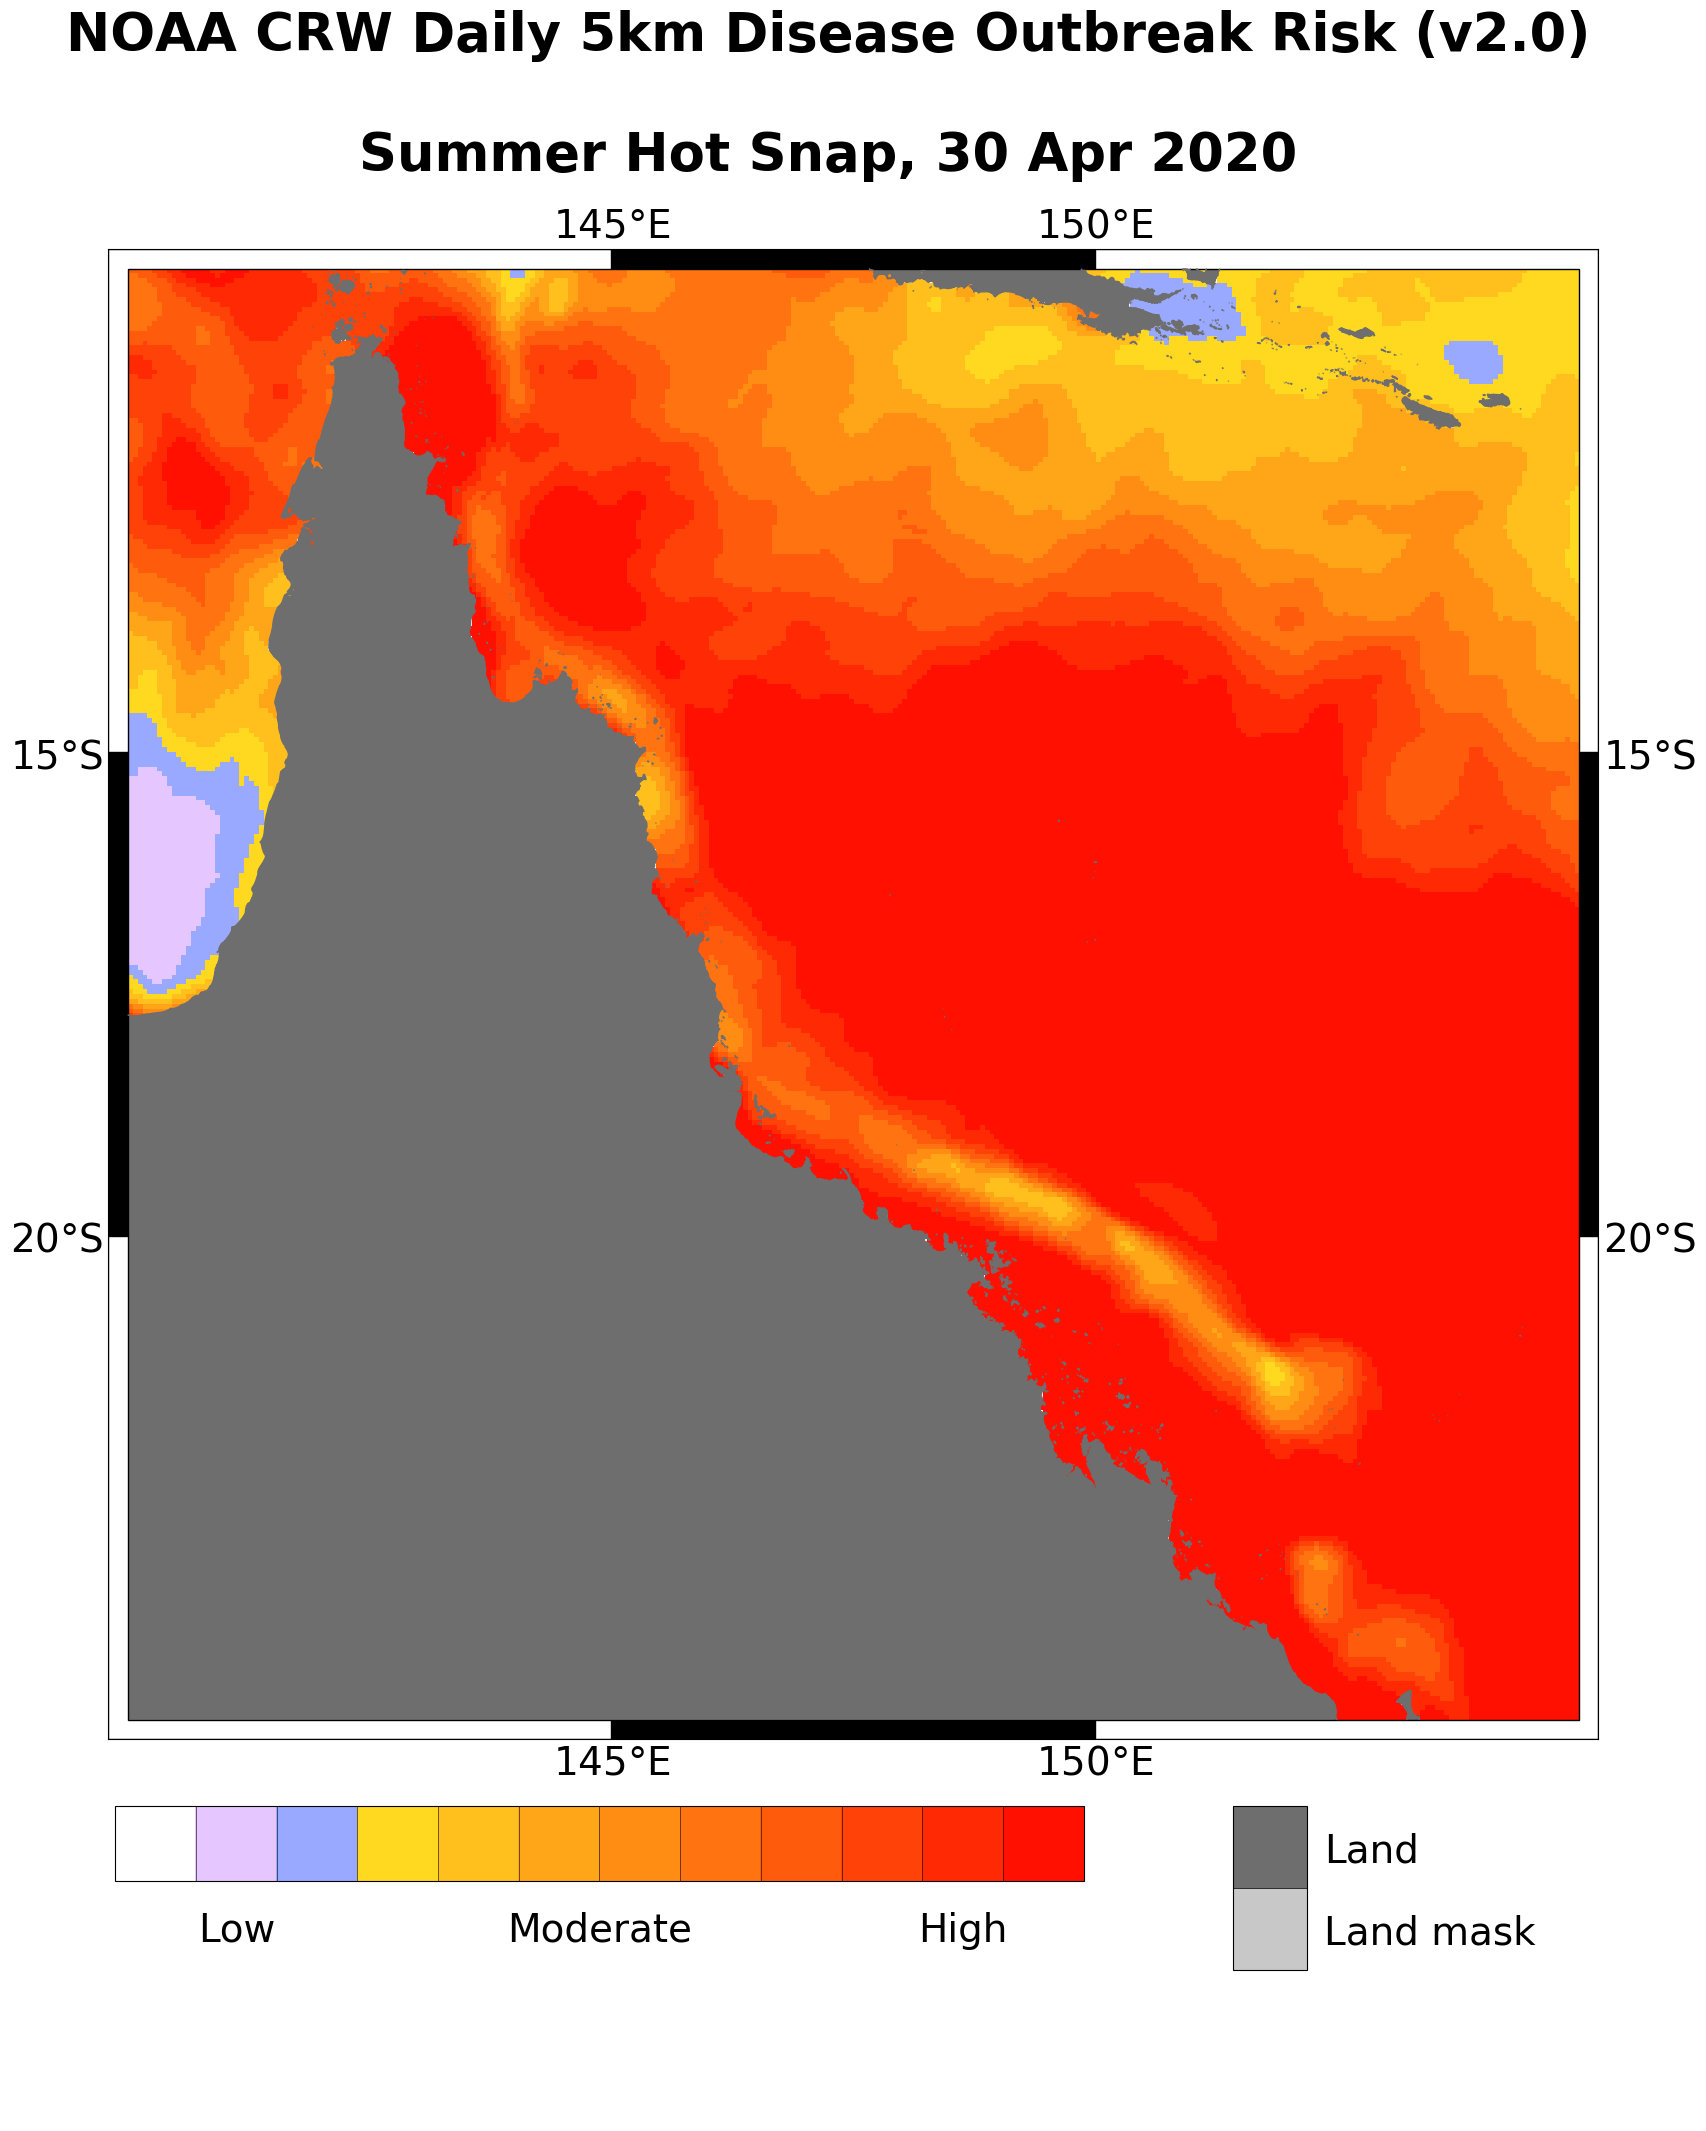
| Units: | Index color values |
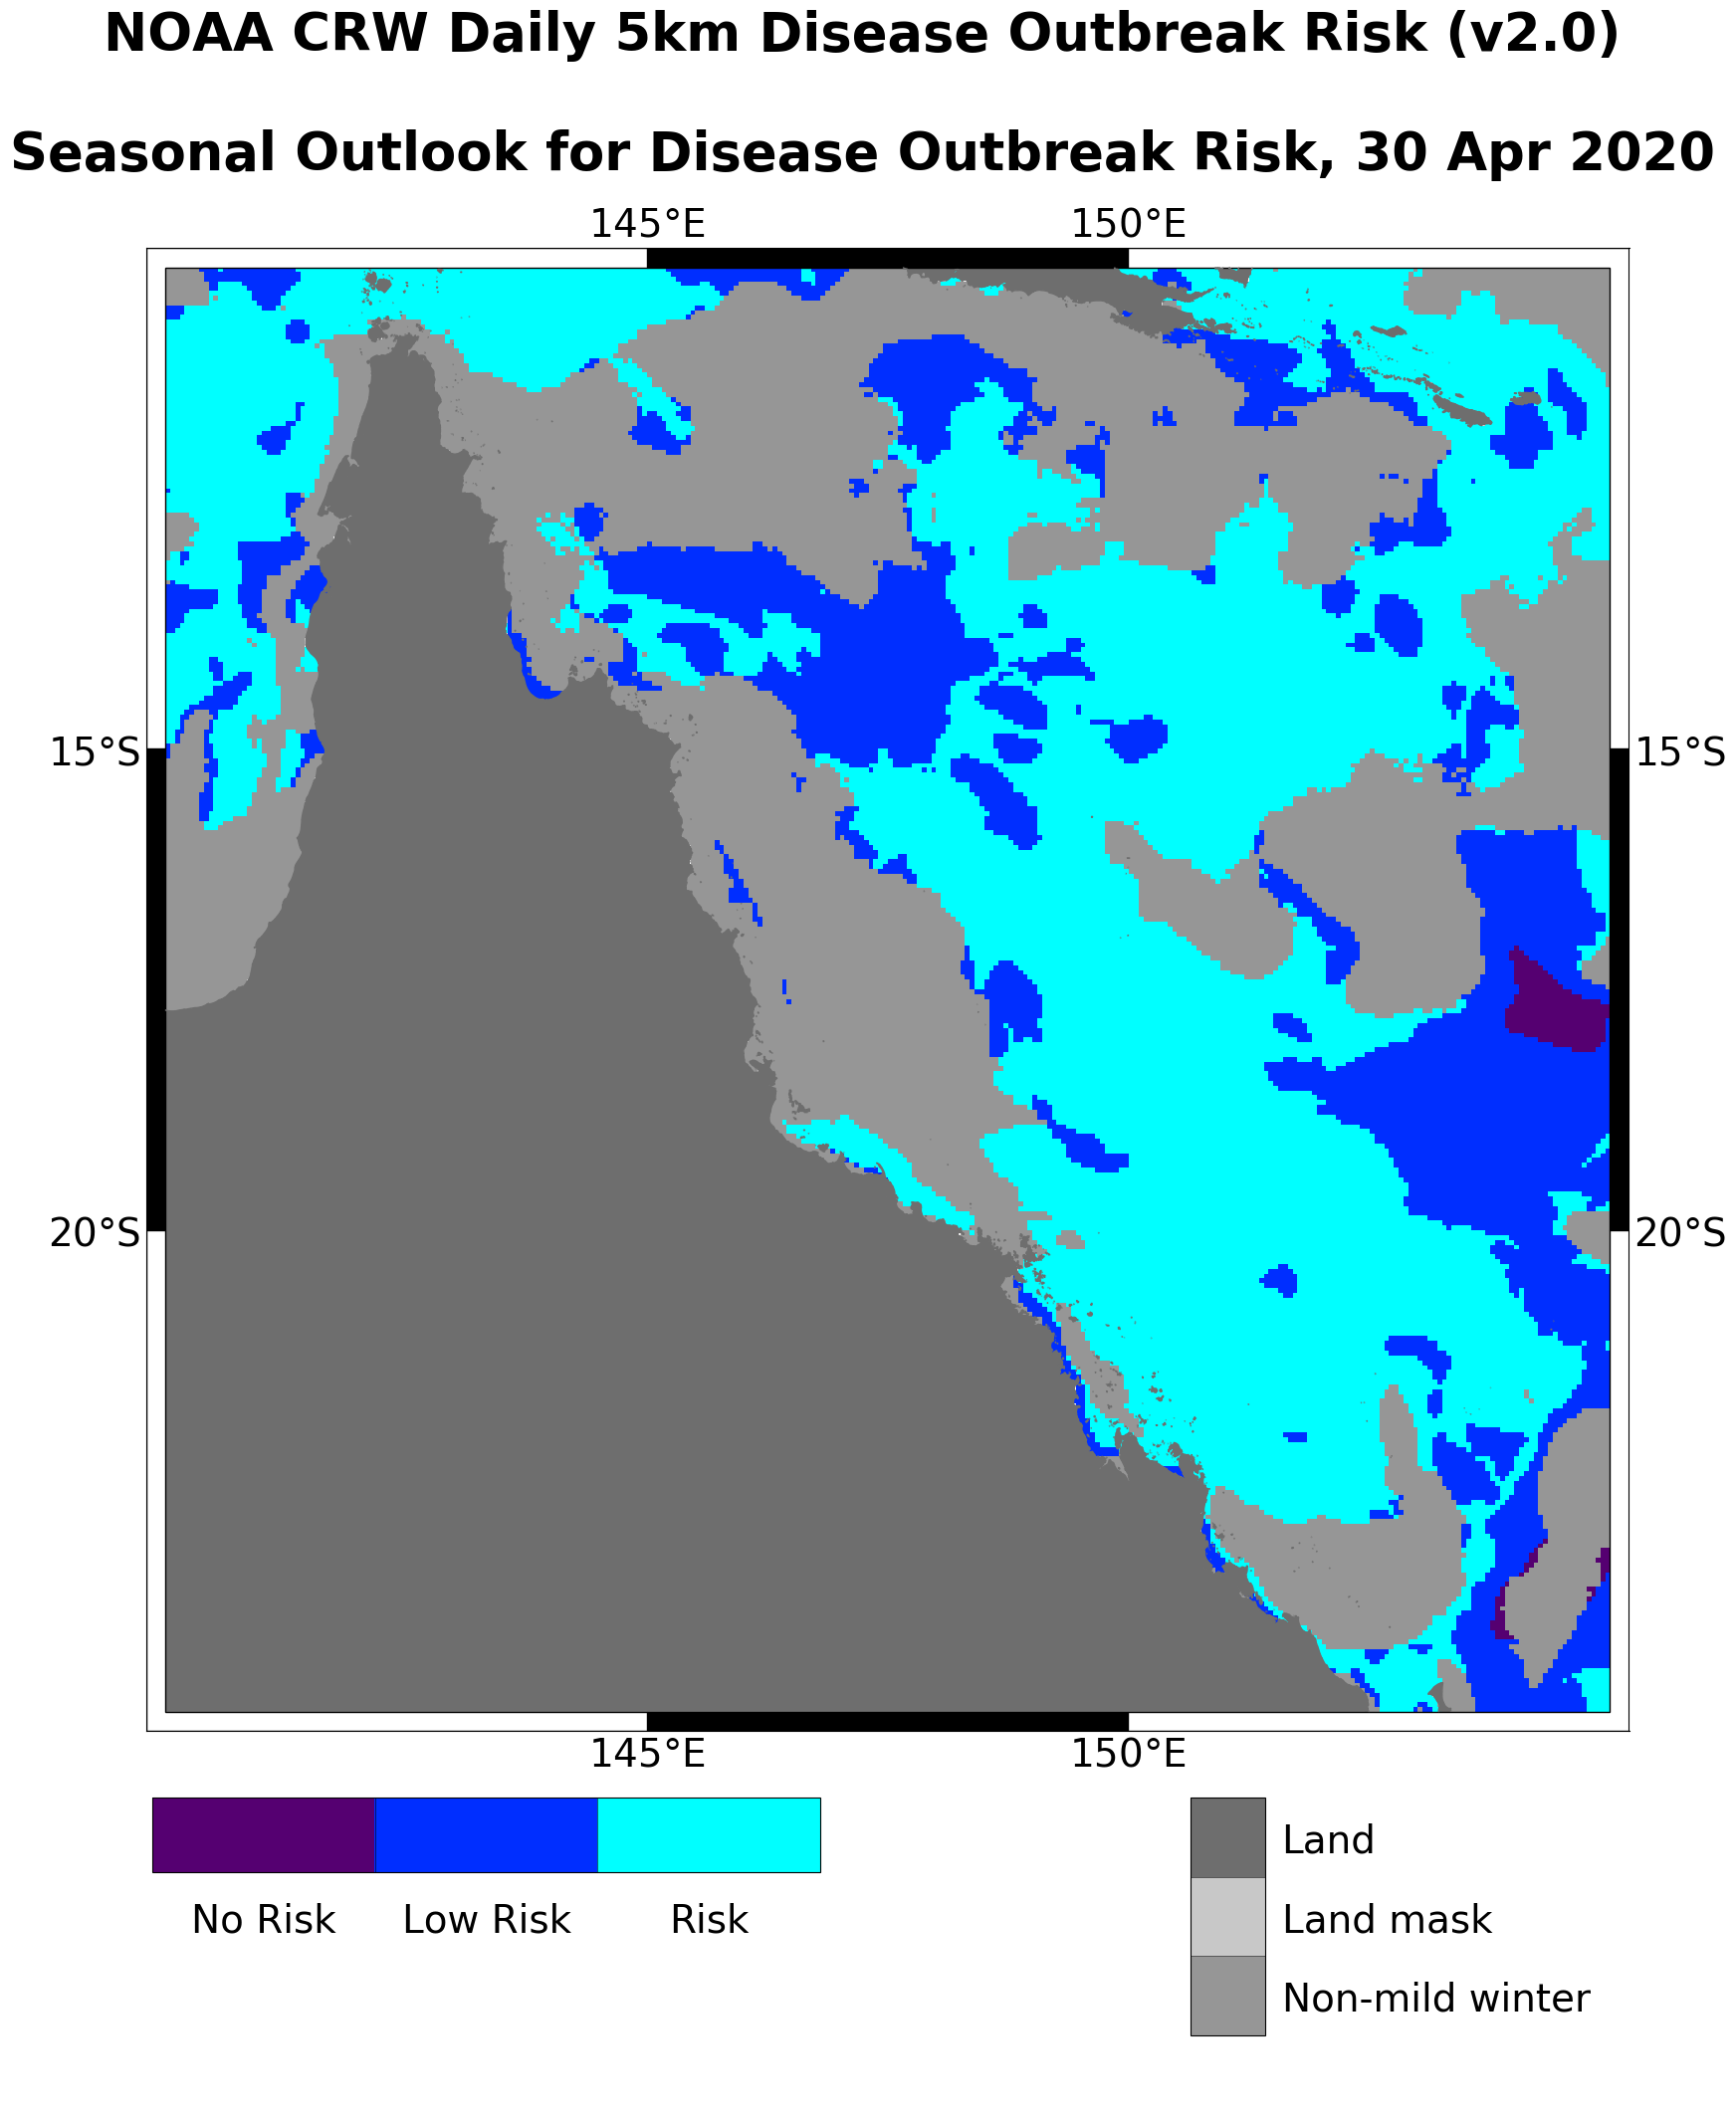
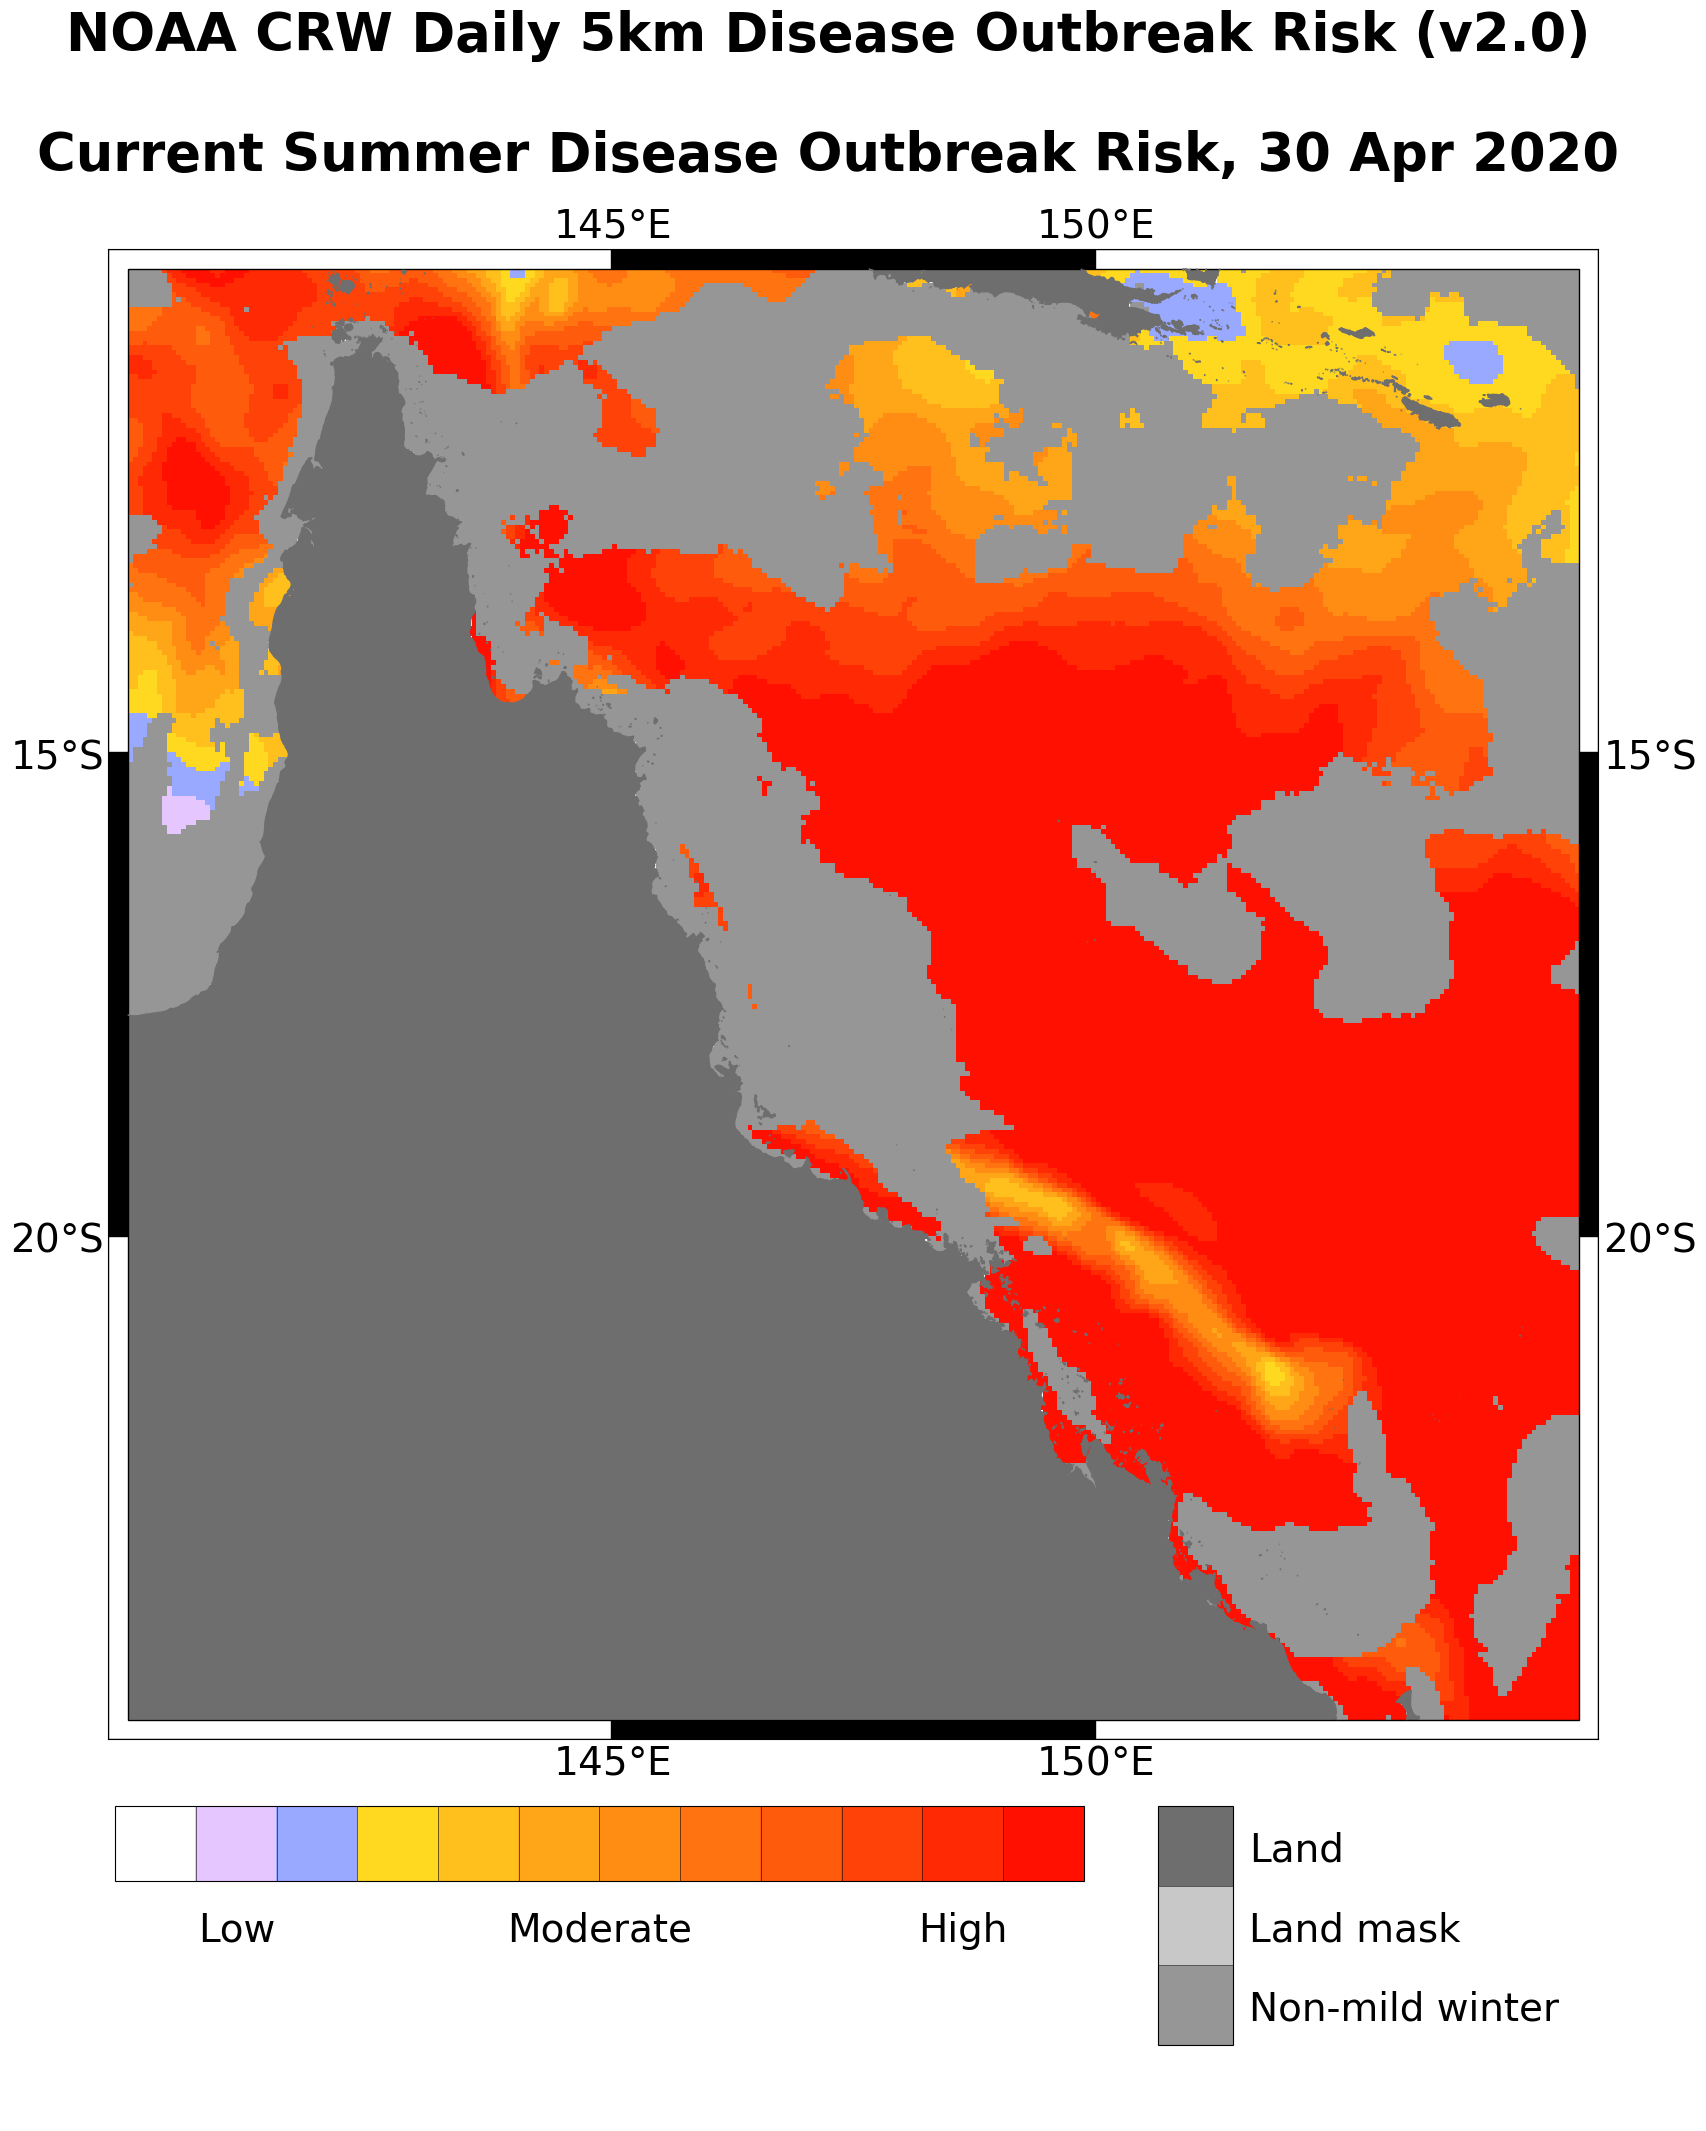
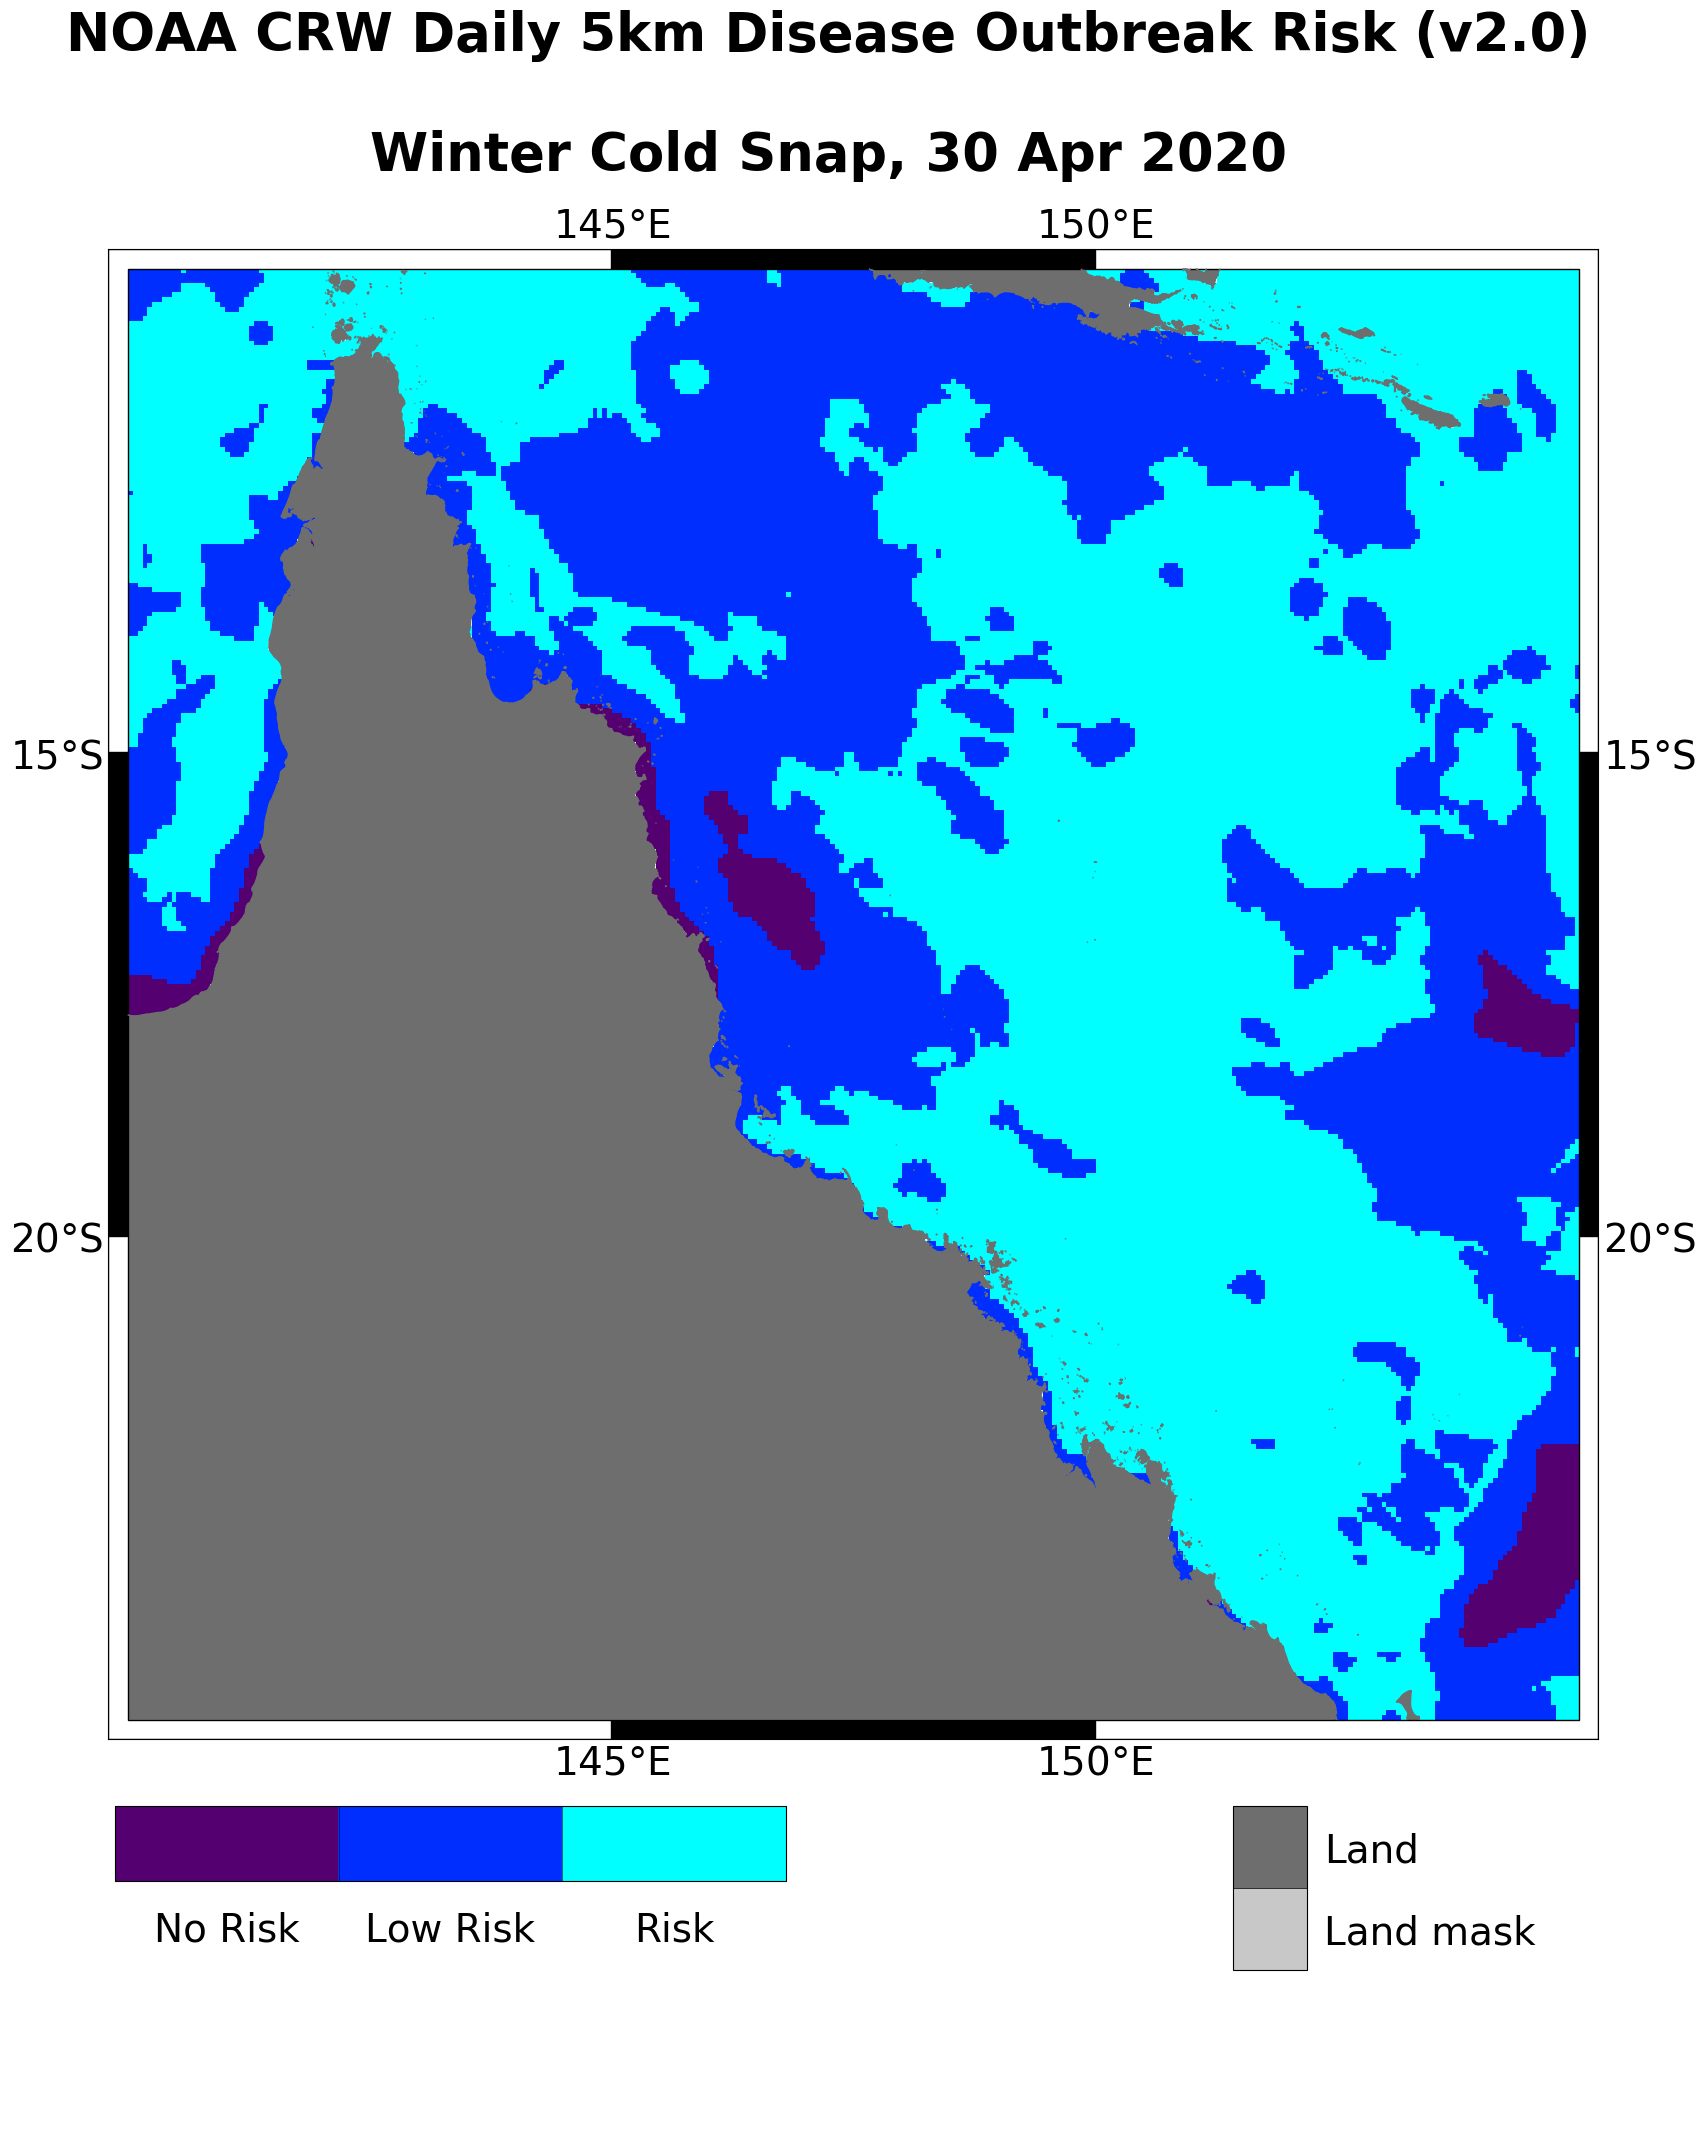
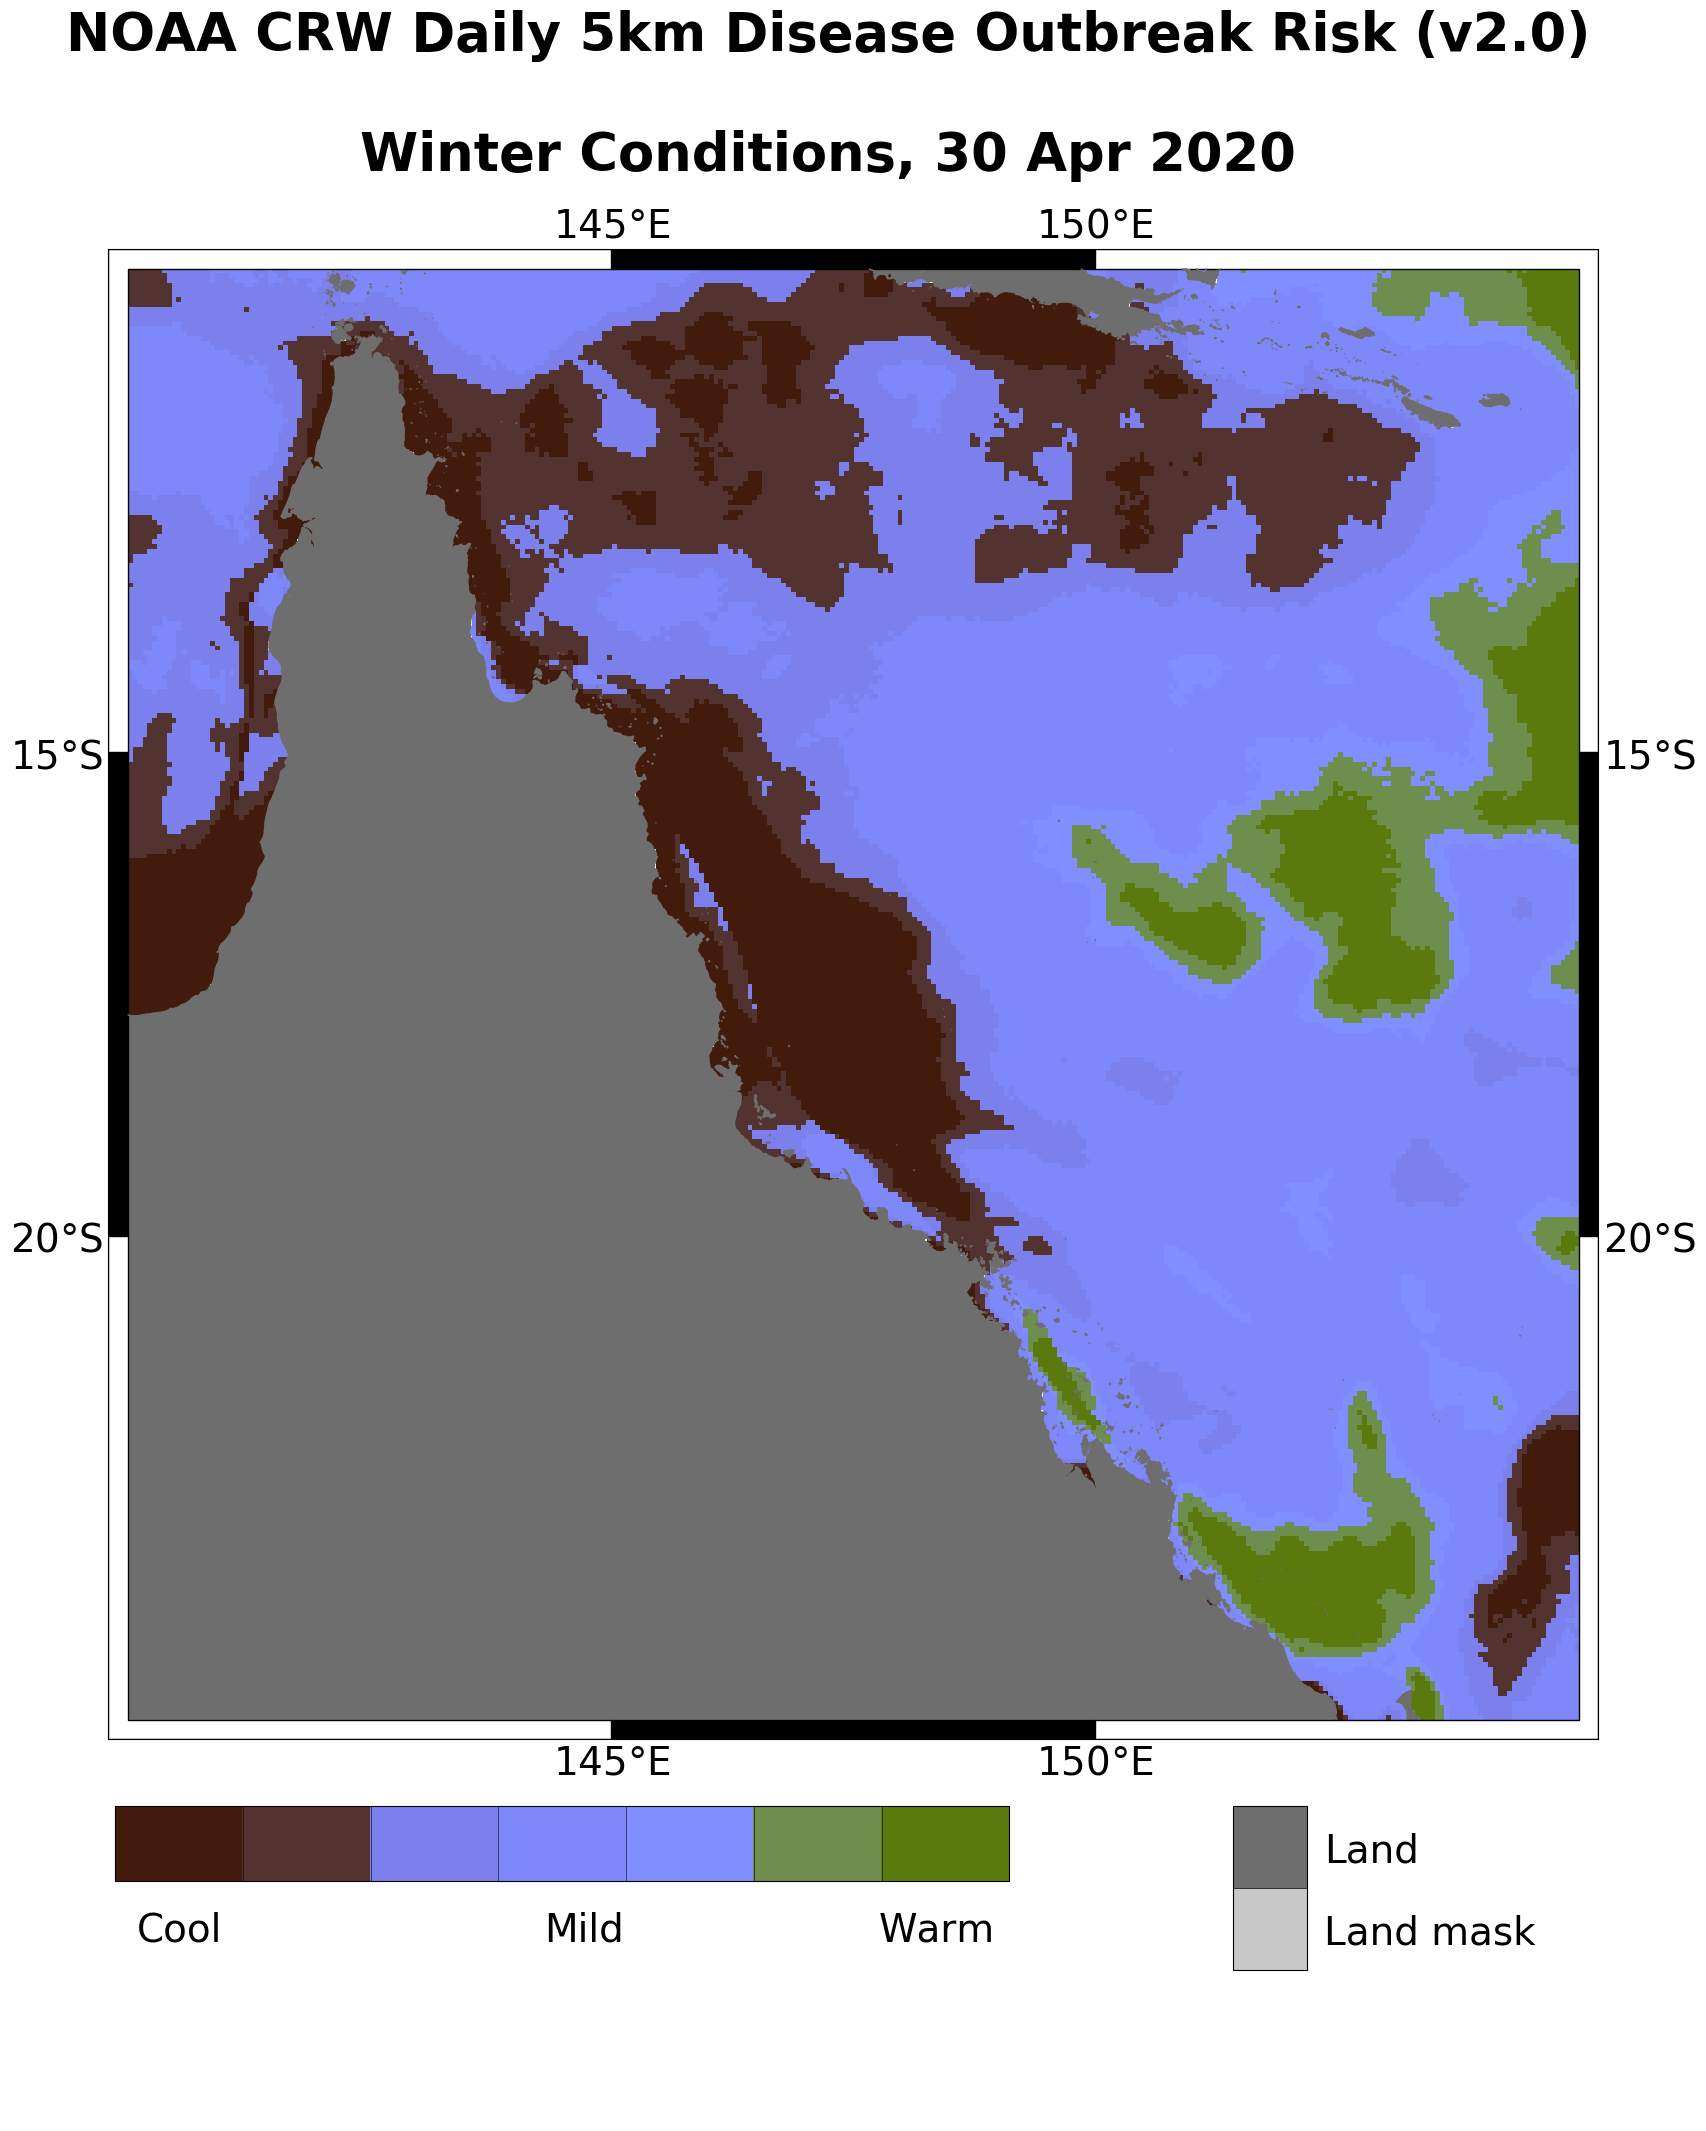
The NOAA Coral Reef Watch Coral Disease Outbreak Risk Monitoring Products were developed primarily for monitoring and assessing coral disease outbreak, as decision support tools to provide critical and timely coral reef environment information to the U.S. and international coral reef communities.
Are there legal restrictions on access or use of the data?
- Access_Constraints: none
- Use_Constraints:
- Not intended for legal use. Data may contain inaccuracies due to cloud cover and/or other reasons.
NOAA makes no warranty regarding these data and images, expressed or implied, nor does the fact of distribution constitute such a warranty. NOAA cannot assume liability for any damages caused by any errors or omissions in these images, nor as a result of the failure of these data to function on a particular system.
| Data format: | Coral Disease Outbreak Risk web page in format PHP |
|---|---|
| Network links: |
https://coralreefwatch.noaa.gov/product/disease/index.php |
| Media you can order: |
CD-ROM
(format none)
Note: The data formats provided are commonly used. |
| Data format: | Coral Disease Outbreak Risk web page in format PNG |
|---|---|
| Network links: |
https://coralreefwatch.noaa.gov/product/disease/index.php |
| Media you can order: |
CD-ROM
(format none)
Note: The data formats provided are commonly used. |
The products, in various formats, may be downloaded from the website or obtained directly from the distributor.