Integrated hard and soft bottom seafloor substrate map of Ofu-Olosega, American Samoa, combining NOAA Pacific Island Fisheries Science Center Coral Reef Ecosystem Division hard-soft substrate map with NOAA Center for Coastal Monitoring and Assessment Biogeography Program shallow-water benthic habitat map of American Samoa.

Metadata also available as - [Outline] - [Parseable text] - [XML]

Frequently anticipated questions:


What does this data set describe?

Title:
Integrated hard and soft bottom seafloor substrate map of Ofu-Olosega, American Samoa, combining NOAA Pacific Island Fisheries Science Center Coral Reef Ecosystem Division hard-soft substrate map with NOAA Center for Coastal Monitoring and Assessment Biogeography Program shallow-water benthic habitat map of American Samoa.
Abstract:
Hard and soft seafloor substrate map, derived from integrating two existing map products: hard and soft seafloor substrate map derived from an unsupervised classification of multibeam backscatter and bathymetry derivatives, produced by NOAA Pacific Island Fisheries Science Center Coral Reef Ecosystem Division (CRED), and shallow-water benthic habitat map of American Samoa, produced by NOAA Center for Coastal Monitoring and Assessment Biogeography Program. Please refer to separate metadata and documentation for these two products: Substrate - hard bottom vs. soft bottom - 5 meter grid http://www.soest.hawaii.edu/pibhmc/pibhmc_amsamoa_ofu_geomorph.htm Shallow-water benthic habitat map http://ccma.nos.noaa.gov/ecosystems/coralreef/us_pac_terr/ This data is for Ofu-Olosega Islands, Territory of American Samoa, USA.
Supplemental_Information:
The hard and soft substrate map produced by NOAA Pacific Islands Fisheries Science Center Coral Reef Ecosystem Division was derived using Reson 8101 backscatter data, bathymetric variance (at 2 scales) and bathymetric rugosity. The sonar frequency is 240 kHz for the Reson 8101 multibeam data. Bathymetry and backscatter data were resampled to 5 m grid cell size prior to the classification. As limited seafloor photographs for groundtruthing were available for Ofu-Olosega at the time of production, the classification was unsupervised. However, in locations such as French Frigate Shoals, NWHI and Tutuila, American Samoa, where ground truth data were available, the unsupervised classification method has been found to be a good predictor of substrate type in similar depth ranges and seafloor environments. The shallow-water habitat map produced by NOAA Biogeography Branch was derived by digitally delineating habitat boundaries from georeferenced sonar and orthorectified IKONOS satellite imagery in ArcGIS using the NOAA Habitat Digitizing extension. A first draft map was completed, and areas identified for ground validation. At each ground validation point benthic habitat was characterized by drop camera, free diving or surface observation. A second draft map was produced incorporating the ground validation data.
  1. How might this data set be cited?
    Pacific Islands Benthic Habitat Mapping Center (PIBHMC), Coral Reef Ecosystem Division (CRED), Pacific Islands Fisheries Science Center (PIFSC), National Marine Fisheries Service (NMFS), National Oceanic and Atmospheric Administration (NOAA), 20130125, Integrated hard and soft bottom seafloor substrate map of Ofu-Olosega, American Samoa, combining NOAA Pacific Island Fisheries Science Center Coral Reef Ecosystem Division hard-soft substrate map with NOAA Center for Coastal Monitoring and Assessment Biogeography Program shallow-water benthic habitat map of American Samoa..

    Online Links:

  2. What geographic area does the data set cover?
    West_Bounding_Coordinate: -169.705274
    East_Bounding_Coordinate: -169.583687
    North_Bounding_Coordinate: -14.133505
    South_Bounding_Coordinate: -14.203385
  3. What does it look like?
    http://www.soest.hawaii.edu/pibhmc/amsamoa_images/ofu_5m_hs_int_445.jpg (JPEG, PDF)
    Hard and Soft Seafloor Substrate
  4. Does the data set describe conditions during a particular time period?
    Beginning_Date: 2002
    Ending_Date: 2010
    Currentness_Reference: ground condition
  5. What is the general form of this data set?
    Geospatial_Data_Presentation_Form: digital data
  6. How does the data set represent geographic features?
    1. How are geographic features stored in the data set?
      This is a Raster data set. It contains the following raster data types:
      • Dimensions 1532 x 2915 x 1, type Grid Cell
    2. What coordinate system is used to represent geographic features?
      Grid_Coordinate_System_Name: Universal Transverse Mercator
      Universal_Transverse_Mercator:
      UTM_Zone_Number: -2
      Transverse_Mercator:
      Scale_Factor_at_Central_Meridian: 0.9996
      Longitude_of_Central_Meridian: -171
      Latitude_of_Projection_Origin: 0
      False_Easting: 500000
      False_Northing: 10000000
      Planar coordinates are encoded using row and column
      Abscissae (x-coordinates) are specified to the nearest 5
      Ordinates (y-coordinates) are specified to the nearest 5
      Planar coordinates are specified in meters
      The horizontal datum used is D_WGS_1984.
      The ellipsoid used is WGS_1984.
      The semi-major axis of the ellipsoid used is 6378137.000000.
      The flattening of the ellipsoid used is 1/298.257224.
      Vertical_Coordinate_System_Definition:
      Depth_System_Definition:
      Depth_Datum_Name: mean lower low water
      Depth_Resolution: 0.01
      Depth_Distance_Units: meters
      Depth_Encoding_Method: Attribute values
  7. How does the data set describe geographic features?
    Entity_and_Attribute_Overview: none
    Entity_and_Attribute_Detail_Citation: none

Who produced the data set?

  1. Who are the originators of the data set? (may include formal authors, digital compilers, and editors)
  2. Who also contributed to the data set?
    PIBHMC, CRED, PIFSC, NOAA, JIMAR, NOS, NCCOS, CCMA, Biogeography Program
  3. To whom should users address questions about the data?
    Pacific Islands Benthic Habitat Mapping Center (PIBHMC), Coral Reef Ecosystem Division (CRED), Pacific Islands Fisheries Science Center (PIFSC), National Marine Fisheries Service (NMFS), National Oceanic and Atmospheric Administration (NOAA)
    NOAA IRC
    Honolulu, HI
    USA

    808 725-5360 (voice)
    nmfs.pic.credinfo@noaa.gov

Why was the data set created?

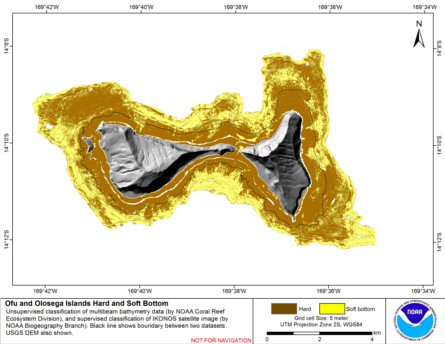
The hard and soft seafloor map previously produced by NOAA Pacific Islands Fisheries Science Center Coral Reef Ecosystem Division is being used to improve sampling techniques for long-term ecosystem monitoring, to guide future ground-truthing operations and to identify coral-rich and species specific environments. By combining this initial product with the shallow-water benthic habitat map produced by NOAA Biogeography Branch, a more complete hard and soft substrate map is produced, which fills in many of the gaps in shallow water.

How was the data set created?

  1. From what previous works were the data drawn?
  2. How were the data generated, processed, and modified?
    Date: 05-Dec-2012 (process 1 of 1)
    The process description to produce the CRED hard-soft substrate map can be found in the metadata for that product: Substrate - hard bottom vs. soft bottom - 5 meter grid ftp://ftp.soest.hawaii.edu/pibhmc/website/data/amsamoa/benthichabitatlayers/OO_5m_hardsoft.txt The process description to produce the Biogeography Program shallow-water benthic habitat map can be found in the metadata for that product: https://products.coastalscience.noaa.gov/collections/benthic/e99us_pac/ To combine the two maps, several steps had to be first taken with the Biogeography Program shallow-water benthic habitat map. First polygons were deleted that were not required for this product; the polygons covering Ta'u were deleted, leaving only Ofu-Olosega. Then polygons where the Major Reef Structure (M_STRUCT) was either 'Unknown' or 'Other Delineations' were deleted, leaving only polygons where M_STRUCT was 'Coral Reef and Hardbottom' or 'Unconsolidated Sediment.' The polygon shapefile was then converted into an ArcGIS Raster, using the ArcGIS tool, 'Polygon To Raster.'The raster values were checked to ensure that the same value was equivalent to hard substrate as in the CRED hard-soft map, where 'Coral Reef and Hardbottom' was classed as 'hard' and 'Unconsolidated Sediment' was classed as 'soft'. Prior to the combing the maps, a low-pass filter was run over the CRED hard-soft substrate map using the ArcGIS Spatial Analyst Tool, Filter. To combine the two maps, the two raster layers were mosaiced, using the ArcGIS tool, 'Mosaic To New Raster.' Due to a wide area of overlap between the two datasets, it was necessary to make a decision on how to treat the two datasets in these areas. As the two datasets were produced from different methods, and from different underlying data (multibeam bathymetry versus satellite imagery) there were naturally discrepancies between the two datasets, particularly obvious along the reef edge north of Ofu-Olosega. Below the reef slope which runs along the island, the NOAA Biogeography Branch habitat map shows soft substrate, following along the contour of the base of the reef slope. In contrast the CRED hard-soft substrate map shows predominantly hard substrate with soft substrate in patches. Examination of three towed-camera sled dives, collected during cruise SB1216 in November 2012, showed that in two locations the CRED hard-soft substrate map provided a better representation of the surface substrate, whereas in the third, the Biogeography Branch habitat map provided a better representation while the CRED hard-soft substrate map under-represented soft substrate in this area. A pragmatic decision was taken to mosaic the two datasets using the 'FIRST' method of the ArcToolbox Tool 'Mosaic to new raster' where the CRED hard-soft substrate map was the 'first' raster in the mosaic. This meant that where there was overlap between the two datasets, the CRED hard-soft substrate map was used, and the NOAA Biogeography Branch habitat map was used to fill in gaps. However, even using this method, artifacts in the data remain, notably, along the boundary between the two datasets north west of Olosega. It should also be borne in mind that in some areas the CRED hard-soft map may under-represent soft sediment at the surface, particularly if there is rocky substrate underlying the soft sediment.
  3. What similar or related data should the user be aware of?

How reliable are the data; what problems remain in the data set?

  1. How well have the observations been checked?
    Data are collected for resource management and research purposes and are tested for internal consistency; however, no effort is made to compare these data to external references or to other published data.
  2. How accurate are the geographic locations?
    Horizontal positioning system: GPS (SPS) Horizontal position accuracy: 25 meters
  3. How accurate are the heights or depths?
  4. Where are the gaps in the data? What is missing?
    Complete
  5. How consistent are the relationships among the observations, including topology?
    These data are believed to be logically consistent though no tests were performed

How can someone get a copy of the data set?

Are there legal restrictions on access or use of the data?
Access_Constraints: None
Use_Constraints:
These data are not to be used for navigation purposes. Please acknowledge the NOAA Coral Reef Ecosystem Division, Pacific Islands Fisheries Science Center and the Pacific Islands Benthic Habitat Mapping Center, School of Ocean and Earth Science and Technology, University of Hawaii as the sources of this information.
  1. Who distributes the data set? (Distributor 1 of 1)
    Pacific Islands Benthic Habitat Mapping Center (PIBHMC), Coral Reef Ecosystem Division (CRED), Pacific Islands Fisheries Science Center (PIFSC), National Marine Fisheries Service (NMFS), National Oceanic and Atmospheric Administration (NOAA)
    NOAA IRC
    Honolulu, HI
    USA

    808 725-5360 (voice)
    nmfs.pic.credinfo@noaa.gov
  2. What's the catalog number I need to order this data set? Downloadable Data
  3. What legal disclaimers am I supposed to read?
    These data are not to be used for navigational purposes. NOAA makes no warranty regarding these data, expressed or implied, nor does the fact of distribution constitute such a warranty. NOAA cannot assume liability for any damages caused by any errors or omissions in these data, nor as a result of the failure of these data to function on a particular system.
  4. How can I download or order the data?

Who wrote the metadata?

Dates:
Last modified: 04-May-2022
Metadata author:
Pacific Islands Benthic Habitat Mapping Center (PIBHMC), Coral Reef Ecosystem Division (CRED), Pacific Islands Fisheries Science Center (PIFSC), National Marine Fisheries Service (NMFS), National Oceanic and Atmospheric Administration (NOAA)
NOAA IRC
Honolulu, HI
USA

808 725-5360 (voice)
nmfs.pic.credinfo@noaa.gov
Metadata standard:
FGDC Content Standards for Digital Geospatial Metadata (FGDC-STD-001-1998)

Generated by mp version 2.9.48 on Thu Apr 18 11:02:10 2024