Derived bathymetry of nearshore benthic habitats near Kaanapali, Maui, Hawaii

Metadata also available as - [Outline] - [Parseable text] - [XML]

Frequently anticipated questions:


What does this data set describe?

Title:
Derived bathymetry of nearshore benthic habitats near Kaanapali, Maui, Hawaii
Abstract:
Methods used were adapted from a "cookbook" of instructions developed by Kyle Hogref for using IKONOS imagery data to derive seafloor elevations in optically clear water. This dataset was derived from high-resolution (2 m) imagery from DigitalGlobe's WorldView-2 sensor of the Kaanapali area of Maui, Hawaii. Sensor bands 1,2 and 5 (coastal, blue and near IR respectively) were used to derive depth information. The method assumes uniform water clarity but deviations from that condition made extraction difficult in water greater than 30 m depth in the Kaanapali scene used. Results show that biotic material or sediment in the water column skewed results shallower if the material has a high albedo and deeper if the material has a low albedo. Nearshore areas were significantly less impacted in the Kaanapali area, due to the geomorphology of the area and the hi resolution and quality of the imagery, allowing visual descrimination of apparent sediment in the water column. For presentation purposes the map product shows an Inverse Distance Weighted interpolated bathymetry surface, restricted to data within 600 m of the shoreline.
Supplemental_Information:
LiDAR bathymetry of Kaanapali, Maui from Scanning Hydrographic Airborne Operational LiDAR data from the United States Army Corps of Engineers Joint Airborne LiDAR Bathymertry Technical Center for Expertise. Multibeam sonar data from the Main Hawaiian Islands Bathymetry synthesis maintained by the Hawaii Mapping Research Group at the University of Hawaii, School of Ocean and Earth Science and Technology.
  1. How might this data set be cited?
    Pacific Islands Benthic Habitat Mapping Center (PIBHMC), Coral Reef Ecosystem Division (CRED), Pacific Islands Fisheries Science Center (PIFSC), National Marine Fisheries Service (NMFS), National Oceanic and Atmospheric Administration (NOAA), 20111012, Derived bathymetry of nearshore benthic habitats near Kaanapali, Maui, Hawaii.

    Online Links:

  2. What geographic area does the data set cover?
    West_Bounding_Coordinate: -156.7760
    East_Bounding_Coordinate: -156.6470
    North_Bounding_Coordinate: 20.9839
    South_Bounding_Coordinate: 20.8357
  3. What does it look like?
    http://www.soest.hawaii.edu/pibhmc/MHI_images/KaanapaliDerivedBathy_445.jpg (JPEG)
    Layout of data on original satellite imagery
  4. Does the data set describe conditions during a particular time period?
    Beginning_Date: 06-Apr-2010
    Ending_Date: 06-Apr-2010
    Currentness_Reference: ground condition
  5. What is the general form of this data set?
  6. How does the data set represent geographic features?
    1. How are geographic features stored in the data set?
      This is a Raster data set. It contains the following raster data types:
      • Dimensions 5445 x 5920 x 1, type Grid Cell
    2. What coordinate system is used to represent geographic features?
      Grid_Coordinate_System_Name: Universal Transverse Mercator
      Universal_Transverse_Mercator:
      UTM_Zone_Number: 4
      Transverse_Mercator:
      Scale_Factor_at_Central_Meridian: 0.9996
      Longitude_of_Central_Meridian: -159
      Latitude_of_Projection_Origin: 0.0
      False_Easting: 500000
      False_Northing: 0.0
      Planar coordinates are encoded using Row and Column
      Abscissae (x-coordinates) are specified to the nearest 5
      Ordinates (y-coordinates) are specified to the nearest 5
      Planar coordinates are specified in meters
      The horizontal datum used is D_WGS_1984.
      The ellipsoid used is WGS_1984.
      The semi-major axis of the ellipsoid used is 6378137.000000.
      The flattening of the ellipsoid used is 1/298.257224.
      Vertical_Coordinate_System_Definition:
      Depth_System_Definition:
      Depth_Datum_Name: mean lower low water
      Depth_Resolution: 0.01
      Depth_Distance_Units: meters
      Depth_Encoding_Method: Attribute Values
  7. How does the data set describe geographic features?
    Entity_and_Attribute_Overview:
    Depth values are real values based on the average of the soundings that fell within the extracted grid cells. The number of soundings per grid cell range from >1000 soundings in shallow depths to as few as 20 soundings in deeper areas. A total error budget for these data have not been developed. Therefore, the accuracy of depth measurements should be considered to be within 1 meter.
    Entity_and_Attribute_Detail_Citation: none

Who produced the data set?

  1. Who are the originators of the data set? (may include formal authors, digital compilers, and editors)
  2. Who also contributed to the data set?
    PIBHMC, CRED, PIFSC, NOAA, JIMAR and HMRG
  3. To whom should users address questions about the data?
    Pacific Islands Benthic Habitat Mapping Center (PIBHMC), Coral Reef Ecosystem Division (CRED), Pacific Islands Fisheries Science Center (PIFSC), National Marine Fisheries Service (NMFS), National Oceanic and Atmospheric Administration (NOAA)
    NOAA IRC
    Honolulu, HI

    808 725-5360 (voice)
    808 725-5429 (FAX)
    nmfs.pic.credinfo@noaa.gov
    Contact_Instructions: e-mail preferred

Why was the data set created?

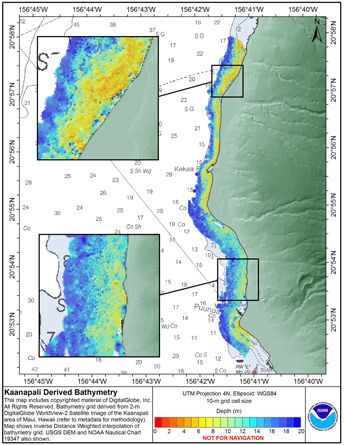
DG WorldView-2 data are used as the base imagery to derived pseudobathymetry of the Kaanapali area of Maui. This area has both SHOALS and multi-beam acoustic derived bathymetry coverage and will provide an example case of the strengths and weaknesses of pseudobathymetry extraction from high resolution satellite imagery methods.

How was the data set created?

  1. From what previous works were the data drawn?
  2. How were the data generated, processed, and modified?
    Date: 12-Oct-2011 (process 1 of 1)
    Multiple tools in ENVI 4.8 were used to complete the following processing steps: Data conversion from digital number to radiance, correction for atmosphere and water surface reflection, linearization of spectral decay as function of depth, masking of non-applicable values, and bathymetric derivation using variables from multiple linear regression analysis. Multiple tools in ArcGIS 10.0 were used for dataset integration and to extract values for the multiple linear regression analysis and subsequent error analyses. The statisitcs program Matlab was used for the multiple linear regression analysis to provide original variables for depth derivation. The multivariate slope intercept formula used to derive depth was D = a + (bi)(xi) + (bj)(xj) Where: D = depth a = intercept b = slope x = the linearized spectral value resulted in 7.8491 - 2.8696(b1) + 7.9593(b2) b1 is the output masked linearized pictral value of each pixel of Coastal band b2 is the output masked linearized pictral value of each pixel of Blue band More information on this integration process is provided in the product error analysis, availble from PIBHMC upon request. This mosaiced derived bathymetry product (JohDBall3) was then integrated with the multibeam sonar data, with sonar data prioritized over derived data, to create the final product (JohDB3MB). A detailed description of all processing steps is available at: ftp://ftp.soest.hawaii.edu/pibhmc/website/webdocs/documentation/Cookbook_042108.pdf An error analysis of each derived bathymetry grid used is available from PIBHMC upon request. To produce the interpolated surface shown in the map, the floating point grid was converted to a point shapefile in Arc GIS 9.3 using the 'float to raster' and 'raster to point' tools in the Arc Toolbox. A buffer of 600m from the shoreline was created and the derived bathymetry points were clipped to exclude data outside this buffer. This distance was chosen to exclude areas of deeper water that were erroneously returning shallow depth values, due to characteristics of the water column. An Inverse Distance Weighted interpolation was run using 3D Analyst, to produce an interpolated surface, with a grid cell size of 10 m, a variable search radius with a maximum distance of 60 m, and using the coastline as a barrier. All other settings used were default. The interpolated surface was clipped using the coastline and a small number of isolated cells were manually deleted.
  3. What similar or related data should the user be aware of?

How reliable are the data; what problems remain in the data set?

  1. How well have the observations been checked?
    Data are collected for resource management and research purposes and are examined for internal consistency; however, no effort is made to compare these data to external references or to other published data.
  2. How accurate are the geographic locations?
    Horizontal positioning system: GPS (SPS) Horizontal position accuracy: 25 m
  3. How accurate are the heights or depths?
    1 m Raw sounding resolution: Variable
  4. Where are the gaps in the data? What is missing?
    Complete
  5. How consistent are the relationships among the observations, including topology?
    These data are believed to be logically consistent though no tests were performed

How can someone get a copy of the data set?

Are there legal restrictions on access or use of the data?
Access_Constraints: none
Use_Constraints:
These data are not to be used for navigation purposes. Please acknowledge the NOAA Pacific Islands Fisheries Science Center, and the Joint Institute for Marine and Atmospheric Research (JIMAR) and Hawaii Mapping Research Group (HMRG) at the University of Hawaii as the sources of this information.
  1. Who distributes the data set? (Distributor 1 of 1)
    Pacific Islands Benthic Habitat Mapping Center (PIBHMC), Coral Reef Ecosystem Division (CRED), Pacific Islands Fisheries Science Center (PIFSC), National Marine Fisheries Service (NMFS), National Oceanic and Atmospheric Administration (NOAA)
    NOAA IRC
    Honolulu, HI

    808 725-5360 (voice)
    808 725-5429 (FAX)
    nmfs.pic.credinfo@noaa.gov
    Contact_Instructions: e-mail preferred
  2. What's the catalog number I need to order this data set? Downloadable Data
  3. What legal disclaimers am I supposed to read?
    These data are not to be used for navigational purposes. NOAA makes no warranty regarding these data, expressed or implied, nor does the fact of distribution constitute such a warranty. NOAA cannot assume liability for any damages caused by any errors or omissions in these data, nor as a result of the failure of these data to function on a particular system.
  4. How can I download or order the data?

Who wrote the metadata?

Dates:
Last modified: 05-Jun-2019
Last Reviewed: 25-Oct-2011
Metadata author:
Pacific Islands Benthic Habitat Mapping Center (PIBHMC), Coral Reef Ecosystem Division (CRED), Pacific Islands Fisheries Science Center (PIFSC), National Marine Fisheries Service (NMFS), National Oceanic and Atmospheric Administration (NOAA)
NOAA IRC
Honolulu, HI

808 725-5360 (voice)
808 725-5429 (FAX)
nmfs.pic.credinfo@noaa.gov
Contact_Instructions: e-mail preferred
Metadata standard:
FGDC Content Standards for Digital Geospatial Metadata (FGDC-STD-001-1998)

Generated by mp version 2.9.48 on Sun Apr 14 10:42:37 2024